Question
In: Economics
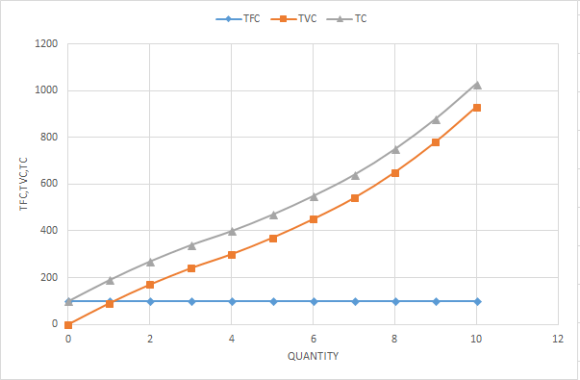
Draw a graph showing the Total Fixed Cost, Total Variable Cost, and Total Cost curves.
INSTRUCTIONS FOR TABLE 1 and Two Graphs-21 points
1) Calculate the Total Cost (TC) for each level of output. (3 points)
2) Calculate the Average Fixed Cost (AFC) for each level of output. (3 points)
3) Calculate the Average Variable Cost (AVC) for each level of output. (3 points)
4) Calculate the Average Total Cost (ATC) for each level of output. (3 points)
5) Calculate the Marginal Cost (MC) for each level of output. (3 points)
Using the data from Table 1 draw two graphs:
Draw a graph showing the Total Fixed Cost, Total Variable Cost, and Total Cost curves. (3 points)
Draw a graph showing the Average Fixed Cost, Average Variable Cost, and Average Total Cost curves and Marginal Cost curve. (3 points)
TABLE 1
(1) (2) (3) (4) (5) (6) (7) (8)
Total Total Total Total Average Average Average Marginal
Product Fixed Variable Cost Fixed Variable Total Cost
Cost Cost Cost Cost Cost
(Q) (TFC) (TVC) (TC) (AFC) (AVC) (ATC) (MC)
0 $100 0 $______ ______
1 100 90 ______ ______ ______ ______ ______
2 100 170 ______ ______ ______ ______ ______
3 100 240 ______ ______ ______ ______ ______
4 100 300 ______ ______ ______ ______ ______
5 100 370 ______ ______ ______ ______ ______
6 100 450 ______ ______ ______ ______ ______
7 100 540 ______ ______ ______ ______ ______
8 100 650 ______ ______ ______ ______ ______
9 100 780 ______ ______ ______ ______ ______
10 100 930 ______ ______ ______ ______ ______
Solutions
Expert Solution
| Q | TFC | TVC | TC | AFC | AVC | AC | MC |
| 0 | 100 | 0 | 100 | ||||
| 1 | 100 | 90 | 190 | 100 | 90 | 190 | 90 |
| 2 | 100 | 170 | 270 | 50 | 85 | 135 | 80 |
| 3 | 100 | 240 | 340 | 33 | 80 | 113 | 70 |
| 4 | 100 | 300 | 400 | 25 | 75 | 100 | 60 |
| 5 | 100 | 370 | 470 | 20 | 74 | 94 | 70 |
| 6 | 100 | 450 | 550 | 17 | 75 | 92 | 80 |
| 7 | 100 | 540 | 640 | 14 | 77 | 91 | 90 |
| 8 | 100 | 650 | 750 | 13 | 81 | 94 | 110 |
| 9 | 100 | 780 | 880 | 11 | 87 | 98 | 130 |
| 10 | 100 | 930 | 1030 | 10 | 93 | 103 | 150 |
TC=FC+VC
VC=TC-FC
ATC=TC/Q
AVC=VC/Q
AFC=FC/Q
MC=CHANGE IN TC/CHANGE IN Q

 Rahul Sunny answered 4 years ago
Related Solutions
A. draw a graph showing the marginal cost, average total cost, demand, marginal revenue, and average...
Illustrate the total cost graph. You must include total costs, variable costs and fixed costs.
For the pizza seller whose marginal, average variable and average total cost curves are shown in the graph below
Draw a typical Total Product (TP) curve in one graph. Right under the graph showing the...
Quantity Total Cost Total Fixed Cost Total Variable Cost Average Fixed Cost Average Total Cost Average...
Draw a graph for a monopoly with demand, marginal revenue, and marginal cost curves.
Using a marginal cost (MC), average variable costs (AVC), and average total costs (ATC) curves, graph...
Labor Q Total Fixed Cost Total Variable Cost Total Cost Marginal Cost Average Fixed Cost Average...
quantity of broomsticks fixed cost variable cost total cost average fixed cost average variable cost average...
SUMMARIZE YOUR CALCULATIONS AND USE MICROSOFT EXCEL. DRAW ONE GRAPH SHOWING AVERAGE FIXED COSTS, AVERAGE VARIABLE COSTS, AVERAGE TOTAL COSTS, MARGINAL REVENUE AND MARGINAL COSTS.
- Python previous function: wrtie a function that takes one argument. The function returns True if the...
- A professional couple wishes to purchase a new home costing $750,000, make a 20 percent down...
- Padre holds 100 percent of the outstanding shares of Sonora. On January 1, 2016, Padre transferred...
- Question: Use backtracking algorithm design to write Java code to solve the subset problem: given a...
- Patsy Ltd. produces ice-cream and would like to accurately forecast sales so that it can meet...
- Power Music owns five music stores, where it sells music, instruments, and supplies. In addition, it...
- 4) A client wants to finance the purchase of a house costing $50,000 over a period...