Question
In: Economics
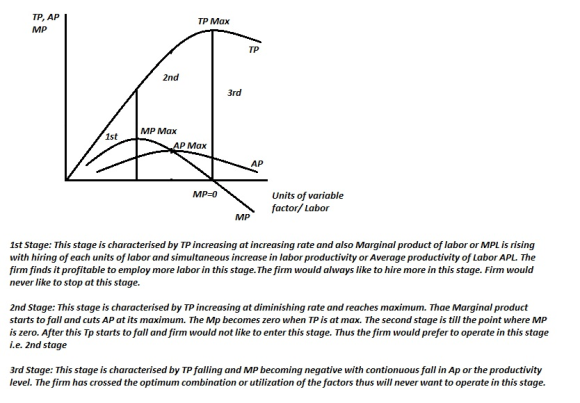
Draw a typical Total Product (TP) curve in one graph. Right under the graph showing the...
- Draw a typical Total Product (TP) curve in one graph.
- Right under the graph showing the TP curve, draw a typical Average Product and Marginal Product curves in another graph; using the same scales.
- On the graphs, show the three stages of production. Justify the rationale for dividing the production process into the three stages.
Solutions
 Rahul Sunny answered 3 years ago
Related Solutions
Total Product Curve. a. Draw a diagram of the total product curve for medical care as...
Total Product Curve.
a. Draw a diagram of the total product curve for medical care as
a function of nurse labor.
b. Explain how the productivity of nurse labor influences the
shape of the curve. Be sure to refer to points on the curve in your
explanation.
c. Graph the marginal and average products for nurse labor.
d. Explain how the two values relate to each.
Draw a graph showing the Total Fixed Cost, Total Variable Cost, and Total Cost curves.
INSTRUCTIONS FOR TABLE 1 and Two Graphs-21 points1) Calculate the Total Cost (TC) for each level of output. (3
points)2) Calculate the Average Fixed Cost
(AFC) for each level of output. (3 points)3) Calculate the Average Variable
Cost (AVC) for each level of output. (3 points)4) Calculate the Average Total Cost
(ATC) for each level of output. (3 points)5) Calculate the Marginal Cost (MC)
for each level of output. (3 points)Using the data from Table 1 draw two graphs:Draw...
Draw a correctly labeled graph showing a long-run average cost curve. Label the sections showing economies of...
Draw a correctly labeled graph showing a long-run average cost
curve. Label the sections showing economies of scale,
diseconomies of scale and constant returns to
scale. Explain economies of scale, constant
returns to scale, and diseconomies of scale.
Multiple Choice
In the long run:
All inputs can be varied.
No inputs can be varied.
Only variable inputs can be varied.
Only fixed inputs can be varied.
A limited number of inputs can be varied.
Sunk costs:
Are costs that can be recovered...
Draw a diagram showing the typical relationship between the Average Total Cost (ATC) and Marginal Cost...
Draw a diagram showing the typical relationship between the
Average Total Cost (ATC) and Marginal Cost (MC) curves for a
firm.
Draw and label a graph showing each stage of a marketing product lifecycle for sales versus...
Draw and label a graph showing each stage of a marketing product
lifecycle for sales versus time. Use an example of a device or a
product to illustrate product development and extension.
A) draw the stres-strain diagram for a typical steel bar under tensile test showing all details...
A) draw the stres-strain diagram for a typical steel
bar under tensile test showing all details of the results of the
test.
B) A material like aluminium does not have an abviouse
yield point and undergoes large starin after the proportionality
limit draw the sketch to show how the arbitrary yield stress is
determined.
C) ASteel sample of diameter 30mm and guage length 60mm gave under
tensile test the following results.
a) load at limit proportionality 70,000N and the extension...
A. draw a graph showing the marginal cost, average total cost, demand, marginal revenue, and average...
A. draw a graph showing the marginal cost, average total cost,
demand, marginal revenue, and average revenue for a perfectly
competitive firm. Indicate the level of profit where profit is
maximized, shade in the area of maximum profit, give the amount of
maximum profit, and explain how this number is calculated.
B.Graph the short-run supply curve for a perfectly competitive
firm and explain where this short-run supply curve lies. Indicate
the following curves on your graph: marginal cost curve, marginal...
Draw a graph for a CwDP firm which faces a demand curve showing Q=0 at P=$12,...
Draw a graph for a CwDP firm which faces a demand curve showing
Q=0 at P=$12, and Q=8 at P=$8, a SRMC curve which interests MR at
Q=8, and SRATC=$6 at Q=8. What level of output should this firm
produce? At that output would the firm make a profit, or loss?
How much per unit and in total?
Using the same information from the previous question, assume
the SRATC changes so that at Q=8 the firm incurs a loss of...
1.Draw and label a typical generator capability curve, showing the Rotor Current limit, stator current limit...
1.Draw and label a typical generator capability curve,
showing the Rotor Current limit, stator current limit and the
origin of the Rotor Current circle. Also include the prime mover
limit.
2. Write down and explain the important formula and relevant
current, voltage and Power limit. Show the correct axes of the
curve. Indicate the safe operating point for the generator on the
curve.
Total product (TP) : Total quantity, or total output, of a particular good or services produced....
Total product (TP) : Total quantity, or total output, of
a particular good or services produced.
Marginal product (MP) : Extra output or added product
associated with adding a unit of a variable resource, in this cas
labor, to the production process
Marginal
product (MP) = Change in total output / change in labor
input
Average product (AP) is total output per unit of a
resource employed.
Question: How do these concepts relate to short and long
run production strategies?
ADVERTISEMENT
ADVERTISEMENT
Latest Questions
- Two 10-cm-diameter charged rings face each other, 15cm apart. The left ring is charged to -29nC...
- Under what conditions would it be possible for an excise tax to have no efficiency cost...
- explain the difference between activities and financial statements of service businesses and merchandising businesses.
- 2. Compare and compare the matrix multiplication algorithm and the Floyd-Warshall algorithm to find all pairs...
- Q: 50.00 ml of 0.5216 M copper(II) nitrate solution is combined with 100.0 ml of 0.5580...
- This is a business law question. Explain how environmental laws regulate the use of toxic substances...
- A sky diver and her parachute system weigh a total of 800 N. She is falling...
ADVERTISEMENT