Question
In: Math
3. A pharmacy is using X bar and R charts to record the time it takes...
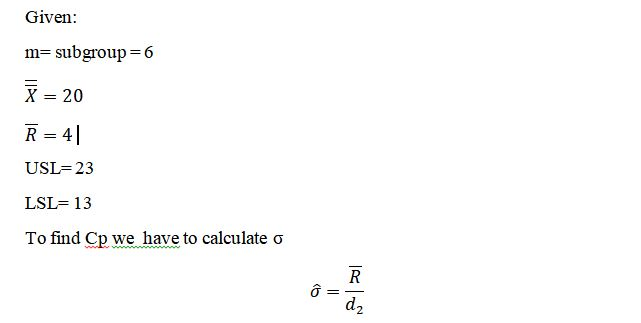
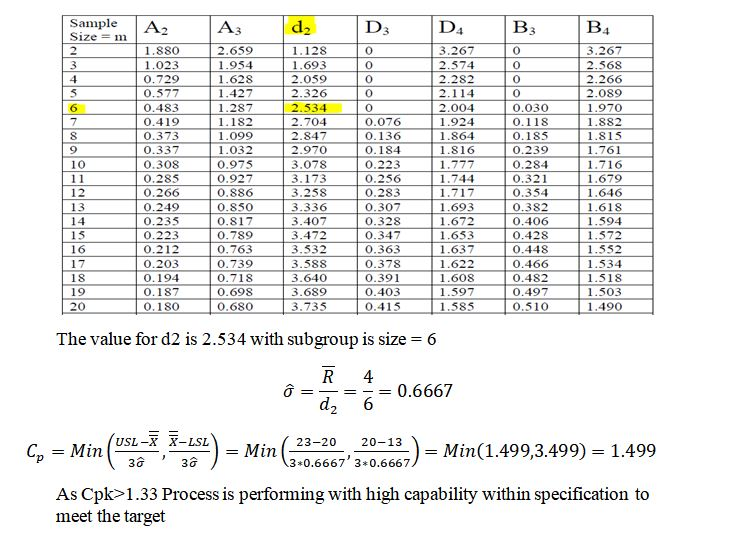
3. A pharmacy is using X bar and R charts to record the time it takes to fill a prescription after the customer has turned in or called in the prescription. Each day, the pharmacy records the times it takes to fill six prescriptions. During a 30-day period, the hospital obtained the following values: X double bar = 20 minutes; R bar = 4 minutes. The upper and lower specifications are 23 minutes and 13 minutes respectively. What is the value of Cpk, to two decimal places?
Solutions
 milcah answered 8 months ago
Related Solutions
2. A pharmacy is using X bar and R charts to record the time it takes...
2. A pharmacy is using X bar and R charts to record the time it
takes to fill a prescription after the customer has turned in or
called in the prescription. Each day, the pharmacy records the
times it takes to fill six prescriptions. During a 30-day period,
the hospital obtained the following values: X double bar = 20
minutes; R bar = 4 minutes. The upper and lower specifications are
23 minutes and 13 minutes respectively. What is the...
1. A pharmacy is using X bar and R charts to record the time it takes...
1. A pharmacy is using X bar and R charts to record the time it
takes to fill a prescription after the customer has turned in or
called in the prescription. Each day, the pharmacy records the
times it takes to fill six prescriptions. During a 30-day period,
the hospital obtained the following values: X double bar = 20
minutes; R bar = 4 minutes. The upper and lower specifications are
23 minutes and 13 minutes respectively. What is the...
A large bank established X-Bar and R charts for the time required to process applications for...
A large bank established X-Bar and R charts for the time
required to process applications for its charge cards. A sample of
five applications is taken each day. The first four weeks (20 days)
of data give:
X bar bar = 16 min s bar = 3 min R bar = 7
min
Based on the values given, calculate the centerline and
control limits for the X bar and R charts.
Discuss the purposes and differences between the C- charts, p-charts and X-bar and R charts. 2....
Discuss the purposes and differences between the C- charts,
p-charts and X-bar and R charts.
2. Define Cp and Cpk
3. The capability index allows for some drifting of the process
mean. Discuss what this means in terms of product quality
output.
Use the data in the table below to set up short-run X-bar and R charts using...
Use the data in the table below to set up short-run X-bar and R
charts using the DNOM approach. The nominal dimensions for each
part are TA = 50, TB = 75, TC = 60, TD = 100, and TE = 125.
Sample
Part
M1
M2
M3
1
A
51
50
51
2
A
48
50
52
3
A
50
52
48
4
A
49
51
54
5
A
47
45
52
6
A
49
50
51
7
B
73...
x bar and R control Charts A quality control inspector at the Company B has taken...
x bar and R control Charts
A quality control inspector at the
Company B has taken twenty-five samples with four observations each
of the sample weight (g). The data are shown in the table.
Construct x bar and R control charts for these data. Identify any
out-of- control points. Assume these points (if any) are
assignable. Remove them and recalculate the control limits.
Construct the revised x bar and R control charts. Submit data
(spreadsheet) and charts.
Comment on the...
Use the attached file to make the appropriate x-bar and R charts. You must include the...
Use the attached file to make the appropriate x-bar and R
charts. You must include the data points, center line, upper and
lower control limits. (Remember, only the data points should NOT be
a straight line.)
MEAN
CI x-bar
(Grand Mean)
LCL x-bar
(CI-A2*R-bar)
UCL x-bar
(CI+A2*R-bar)
Sample Range
(Max-Min)
R-bar
(Mean)
UCL R
(R-bar*D4)
1
12.00
12.50
12.47
12.78
13.00
2
12.78
11.18
11.92
11.95
11.86
3
13.30
13.00
12.95
12.98
13.32
4
11.29
12.87
12.53
11.42
12.37
5...
1. Why are X-bar and R-Charts used together? Please Explain. 2. The principal focuses and methods...
1. Why are X-bar and R-Charts used together? Please Explain.
2. The principal focuses and methods of the pioneers of
scientific management, what are they?(as represented by Henry
Gantt, Frederick Taylor, Frank Gilbreth,etc.). In your words, how
is the modern total quality management method different from the
above?
MEAN CI x-bar (Grand Mean) LCL x-bar (CI-A2*R-bar) UCL x-bar (CI+A2*R-bar) Sample Range (Max-Min) R-bar (Mean)...
MEAN
CI
x-bar
(Grand Mean)
LCL
x-bar
(CI-A2*R-bar)
UCL
x-bar
(CI+A2*R-bar)
Sample
Range
(Max-Min)
R-bar
(Mean)
UCL
R
(R-bar*D4)
1
68.51
68.46
68.54
68.34
68.46
68.46
2
68.94
68.2
68.54
68.56
68.7
68.7
3
68.66
68.44
68.55
68.77
68.7
68.64
4
68.49
68.94
68.56
68.62
68.69
68.56
5
68.64
68.63
68.62
68.32
68.34
68.24
6
68.34
68.42
68.99
68.02
68.03
68.47
7
68.99
68.94
68.95
68.95
68.94
68.97
8
68.92
68.91
68.97
68.93
68.96
68.95
GRAND MEAN
n=
A2=
D4=
A tomato farmer has been using an X-bar and R chart to control the yield per...
A tomato farmer has been using an X-bar and R chart to control
the yield per plant on her highly-mechanized farm. The yield is
table over time in both variability and location. The X-bar chart
has a centerline value of 10.50 pounds and the upper control limit
is 14.20 pounds.
Find the value of the lower control limit of the X-bar
chart?
Find the value of the upper and lower one-sigma and two-sigma
zones of the X-bar chart?
Find the...
ADVERTISEMENT
ADVERTISEMENT
Latest Questions
- Graph a Monopoly. Compare the price, quantity, and ATC of a monopoly with a perfectly competitive...
- Problem 18-12 Various shareholders' equity topics; comprehensive [LO18-1, 18-4, 18-5, 18-6, 18-7, 18-8] Part A In...
- Hello There, This is discussion Question For Advanced Database Systems Question: (a) Please define what a...
- Physicians at a clinic gave what they thought were drugs to 860860 patients. Although the doctors...
- On January 1, 2018, bonds with a face value of $ 79,000 were sold. The bonds...
- How do I make this sort in true alphabetical order instead of ascii(ABCabc) order? I am...
- As a healthcare provider in physical therapy, athletic training, or as an exercise scientist and personal...
ADVERTISEMENT