Question
In: Accounting
In alphabetical order, the six most common last names in the United States in 2018
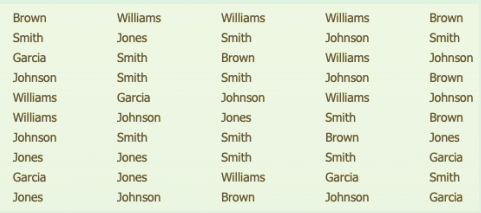
In alphabetical order, the six most common last names in the United States in 2018 are Brown, Garcia, Johnson, Jones, Smith, and Williams (United States Census Bureau website). Assume that a sample of 50 individuals with one of these last names provided the following data:

- Relative and percent frequency distributions
- A bar chart
- A sorted bar chart
- A pie chart
- Based on these data, what are the most common last names? Which type of chart makes this most apparent?
Solutions
Expert Solution
Part 1:
The given data can be summarized by relative and percent frequency distribution as,
|
Names |
Frequency |
Relative frequency |
Percent frequency |
|
Brown |
7 |
7/50 = 0.14 |
14 |
|
Garcia |
6 |
8/50 = 0.12 |
12 |
|
Johnson |
10 |
10/50 = 0.2 |
20 |
|
Jones |
7 |
7/50 = 0.14 |
14 |
|
Smith |
12 |
12/50 = 0.24 |
24 |
|
Williams |
8 |
8/50 = 0.16 |
16 |
|
Sum |
50 |
1 |
100 |
Part 2:
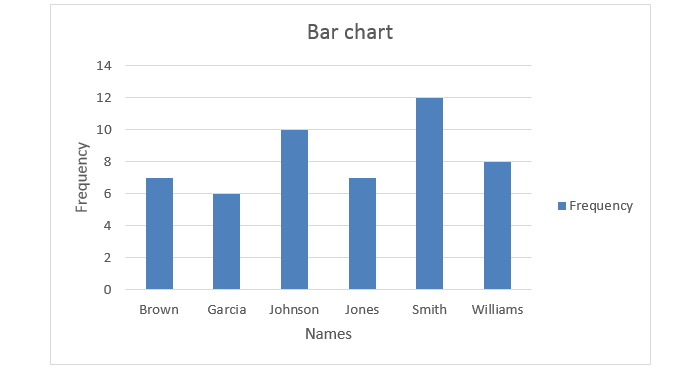
We construct the bar chart by using the step by step procedure in excel as below:
- Enter the frequency distribution in the excel sheet.
- Select the data
- Go to Insert tab > Charts > Select Insert Clustered column chart.
The output will be displayed as below:

Part 3:
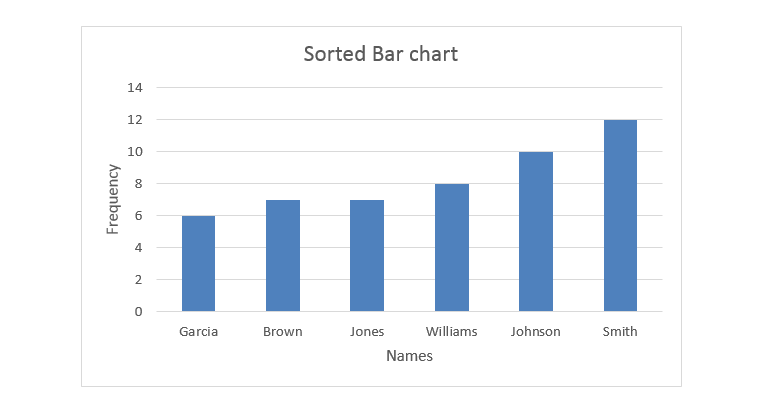
We construct the sorted bar chart by using the step by step procedure in excel as below:
- Enter the frequency distribution in the excel sheet.
- Sort the frequency in ascending order.
- Select the data
- Go to Insert tab > Charts > Select Clustered column chart
The output will be displayed as below:

Part 4:
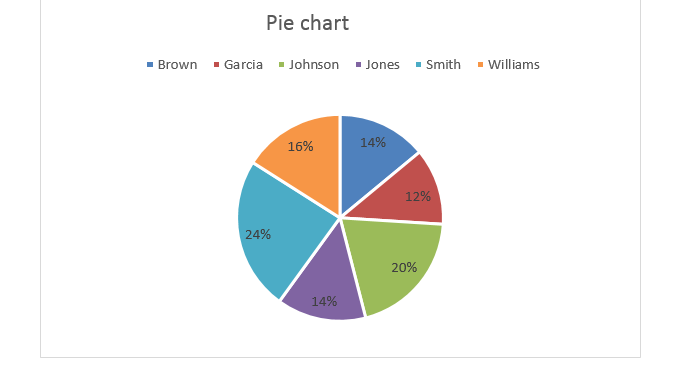
We construct the pie chart by using the step by step procedure in excel as below:
• Enter the frequency distribution in the excel sheet.
• Select the data
• Go to Insert tab > Charts > Select Insert Pie or Doughnut chart
The output will be displayed as below:

Part 5:
The most common last names are,
Smith, Johnson, and Williams.
The bar chart and sorted bar chart make it more apparent.
Answers can be found in the Explanation section.
Related Solutions
Sub-phylum Insecta: Insects ORDER (describe the meaning of the order name) COMMON NAMES (include common names...
This data table lists the most common types of cancer in the United States, and includes...
Create a report that lists all the customers in alphabetical order by last name. The report...
Human papillomavirus (HPV) infection is perhaps the most common STI in the United States and certain...
list 7 most common diseases of potato including a) the disease and pathogen names (common and...
Smoking remains more common in much of Europe than in the United States. In the United...
The last political survey that was carried out in the United States indicates that, of the...
The last political survey that was carried out in the United States indicates that, of the...
what are the six economic functions of the United States government and explain each.
You are deciding to run for President of the United States. In order to win the...
- I asked this question before, but I'm wondering if there are any other ways to do...
- Can you please Describe your actions as the Manager, and how you would manage the project...
- Suppose we have a collection of n different subsets of the set { 1, 2, ...,...
- def read_list(): """ This function should ask the user for a series of integer values (until...
- If two slits are separated by .25cm and the slit to screen is 1m, what is...
- Determine the oxidation number (oxidation state) for the indicated element in each of the following compounds....
- What is the difference between product and production risk? How can they be mitigated?
 DogeShow answered 4 years ago