This post is currently awaiting moderation.
Question
In: Statistics and Probability
Using the histogram shown here, do the following. a. Construct a frequency distribution; include class limits, class frequencies ...
Using the histogram shown here, do the following.
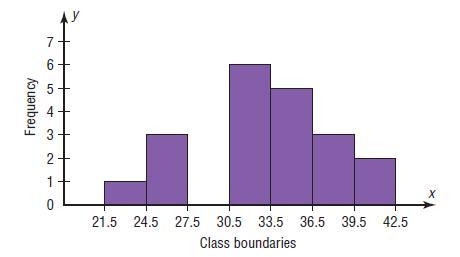
a. Construct a frequency distribution; include class limits, class frequencies, midpoints, and cumulative frequencies.
b. Construct a frequency polygon.
c. Construct an ogive.
Solutions
Expert Solution
a. From the given Histogram,
| Class Limits | Class Boundaries | Midpoints | Frequency |
| 22 – 24 | 21.5 – 24.5 | 23 | 1 |
| 25 – 27 | 24.5 – 27.5 | 26 | 3 |
| 28 – 30 | 27.5 – 30.5 | 29 | 0 |
| 31– 33 | 30.5 – 33.5 | 32 | 6 |
| 34 – 36 | 33.5 – 36.5 | 35 | 5 |
| 37 – 39 | 36.5 – 39.5 | 38 | 3 |
| 40– 42 | 39.5 – 42.5 | 41 | 2 |
| Cumulative Frequency |
|
| Less than 21.5 | 0 |
| Less than 24.5 | 1 |
| Less than 27.5 | 4 |
| Less than 30.5 | 4 |
| Less than 33.5 | 10 |
| Less than 36.5 | 15 |
| Less than 39.5 | 18 |
| Less than 42.5 | 20 |
b.
Frequency polygon to the given data is

c.
Ogive to the given data is

 Junaid answered 3 years ago
Related Solutions
The number of bears killed in 2010 for 52 counties in Pennsylvania is shown in the frequency distribution. Construct a histogram,
The number of bears killed in 2010 for 52 counties in Pennsylvania is shown in the frequency distribution. Construct a histogram, frequency polygon, and ogive for the data. Comment on the skewness of the distribution. How many counties had 75 or fewer bears killed?
–Construct a reasonable frequency distribution of High School GPA (HSGPA) –Construct a histogram –Present the frequency...
–Construct a reasonable frequency distribution of High School
GPA (HSGPA)
–Construct a histogram
–Present the frequency distribution and histogram
There are a total of 196 HS student GPAs. 1.6, 2, 2.1, 2.1, 2.2,
2.2, 2.2, 2.4, 2.4, 2.5, 2.5, 2.5, 2.5, 2.5, 2.6, 2.7, 2.75, 2.75,
2.75, 2.75, 2.75, 2.8, 2.8, 2.8, 2.9, 2.9, 2.9, 3, 3, 3, 3, 3, 3,
3, 3, 3, 3, 3, 3, 3, 3, 3, 3, 3, 3, 3, 3.1, 3.1, 3.1, 3.2, 3.2,
3.2,...
Identify the lower class limits, upper class limits, class width, class midpoints, and class boundaries for the given frequency distribution.
Identify the lower class limits, upper class limits, class width, class midpoints, and class boundaries for the given frequency distribution. Also identify the number of individuals included in the summary. Identify the lower class limits. Identify the upper class limits.Identify the class width.Identify the class midpoints.
Construct a frequency distribution for the given data set using 6 classes. In the table, include...
Construct a frequency distribution for the given data set using
6 classes. In the table, include the midpoints, relative
frequencies, and cumulative frequencies. Which class has the
greatest frequency and which has the least frequency? Amount (in
dollars) spent on books for a semester 524 56 388 225 468 545 213
117 441 405 429 419 481 263 197 145 167 357 50 357 191 204 410 109
473 311 89 88 117 Complete the table, starting with the lowest...
Identify the lower class limits, upper class limits, Blood Platelet Count of class width, class midpoints, and class boundaries for the given frequency distribution
Identify the lower class limits, upper class limits, Blood Platelet Count of class width, class midpoints, and class boundaries for the given frequency distribution. Also identify the number of individuals included in the summaryIdentify the lower class limits.Identify the upper class limits.Identify the class width. Identify the class midpoints.Identify the class boundaries.Identify the number of individuals included in the summary.
Shown is an ogive depicting the cumulative frequency of the average mathematics SAT scores by state. Use it to construct a histogram and a frequency polygon.
Shown is an ogive depicting the cumulative frequency of the average mathematics SAT scores by state. Use it to construct a histogram and a frequency polygon.
The frequency distribution shows the total number of points scored in the Super Bowl games from 1967 to 2012. Construct a histogram, frequency polygon, and ogive for the distribution.
The frequency distribution shows the total number of points scored in the Super Bowl games from 1967 to 2012. Construct a histogram, frequency polygon, and ogive for the distribution. If you were to predict the total number of points for the next Super Bowl game, what range of values would you choose? In how many games were the total points greater than 56?
Use EXCEL Construct Distribution: For each variable, construct Empirical distribution: Frequency Distribution and Relative Frequency Distribution...
Use EXCEL
Construct Distribution:
For each variable, construct Empirical distribution: Frequency
Distribution and Relative Frequency Distribution (and if warranted,
construct Cumulative Relative Distribution.)
Apply a meaningful chart type to present each of the Relative
Frequency Distribution (and Cum. Rel. Freq.) calculated in part
“a”. (Freq. Dist. Plot is not necessary).
Savings
Months Employed
Age
Housing
Credit Risk
1
$739
12
23
Own
Low
2
$1,230
0
32
Own
High
3
$389
119
38
Own
High
4
$347
14
36
Own...
Let Excel choose the classes and do a frequency distribution and histogram for HEADLEN. Let Excel...
Let Excel choose the classes and do a frequency
distribution and histogram for HEADLEN.
Let Excel find the descriptive statistics for the
column HEADLEN.
An anthropologist found what appears to be a
prehistoric bear skull. How could he use this data on headlengths
taken from bears to assess his find?
Identify at least two other professional fields that
might use similar sets of measurements in conducting
research.
HEADLEN
17.0
16.5
16.5
16.0
16.0
16.0
15.5
15.5
15.5
15.5
15.5
15.0...
Make a Frequency Distribution Chart, Histogram and Box and Whiskers Plot for the following set of...
Make a Frequency Distribution Chart, Histogram and Box and
Whiskers Plot for the following set of Data 50, 10, 25, 20, 20, 20,
50,100, 30, 15
ADVERTISEMENT
ADVERTISEMENT
Latest Questions
- Identify which of the perspectives you believe is the BEST for accurately explaining human behavior and...
- What trade policies should a country adopt? why? Explain. Also, find some reference materials on this...
- In Java: Suppose you want to implement a Sudoku game that consists of 9x9 rows and...
- What is the percent yield of the solid product when 17.62 g of iron(III) nitrate reacts...
- Kilgore Natural Gas has $1,000 par value bonds outstanding at 12% interest. The bonds will mature...
- 19.20 grams of barium hydroxide, Ba(OH)2 is dissolved in 178.0 ml of water (you may assume...
- An LC circuit like that in the figure below consists of a 3.40-H inductor and an...
ADVERTISEMENT