Question
In: Math
The x-bar and R values for 20 samples of size five are shown in Table 10E.6....
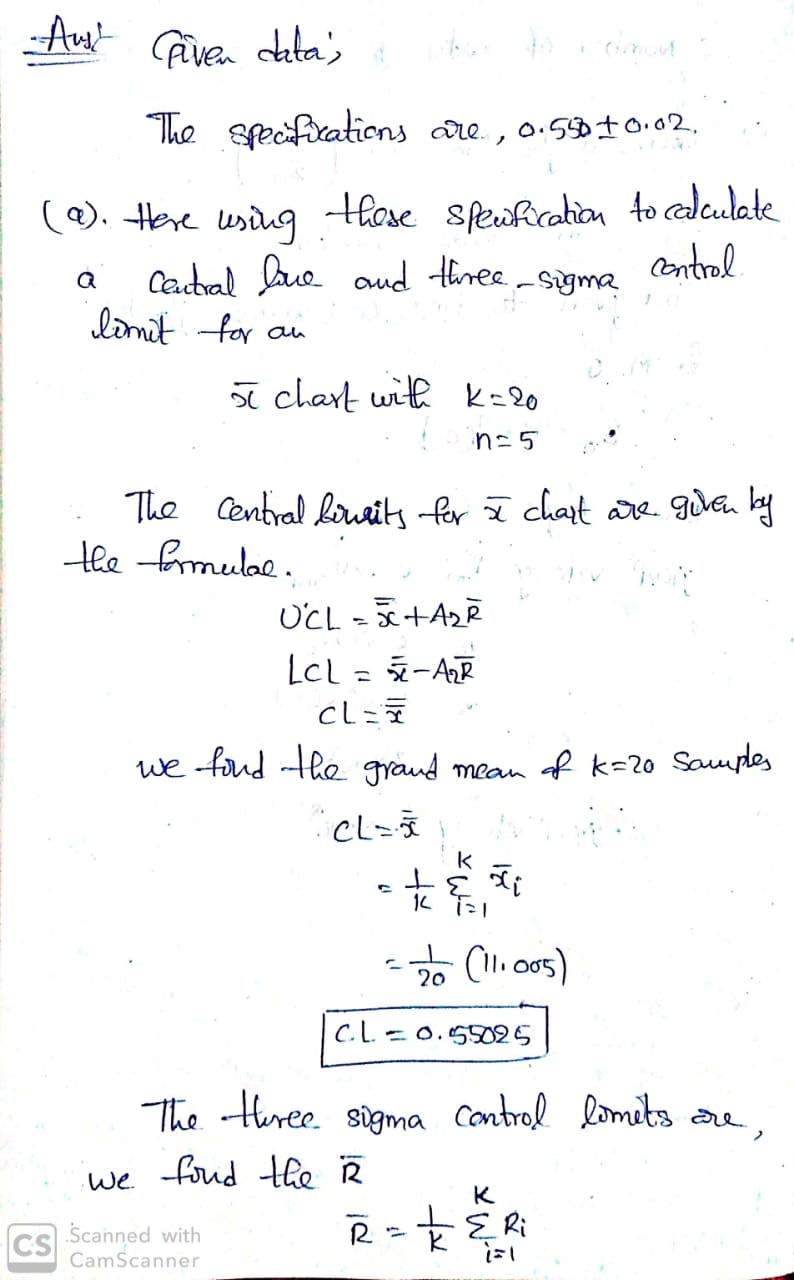
The x-bar and R values for 20 samples of size five are shown in Table 10E.6. Specifications on this product have been established as 0.550 +/- 0.02.
Table 10.E.8
| Sample No. | X Bar | R |
| 1 | 0.549 | 0.0025 |
| 2 | 0.548 | 0.0021 |
| 3 | 0.548 | 0.0023 |
| 4 | 0.551 | 0.0029 |
| 5 | 0.553 | 0.0018 |
| 6 | 0.552 | 0.0017 |
| 7 | 0.550 | 0.0020 |
| 8 | 0.551 | 0.0024 |
| 9 | 0.553 | 0.0022 |
| 10 | 0.556 | 0.0028 |
| 11 | 0.547 | 0.0020 |
| 12 | 0.545 | 0.0030 |
| 13 | 0.549 | 0.0031 |
| 14 | 0.552 | 0.0022 |
| 15 | 0.550 | 0.0023 |
| 16 | 0.548 | 0.0021 |
| 17 | 0.556 | 0.0019 |
| 18 | 0.546 | 0.0018 |
| 19 | 0.550 | 0.0021 |
| 20 | 0.551 | 0.022 |
(a) Construct a modified control chart with α=0.0013, assuming that if the true process
fraction nonconforming is as large as 1%, the process is unacceptable.
(b) Suppose that if the true process fraction nonconforming is as large as 1%, we would like an
acceptance control chart to detect this out-of control condition with probability 0.90.
Construct this acceptance control chart, and compare it to the chart obtained in part (a).
Solutions


 milcah answered 3 months ago
Related Solutions
The following table provides data for 20 samples each of size five. Sample x1 x2 x3...
The following table provides data for 20 samples each of size
five.
Sample
x1
x2
x3
x4
x5
1
4.960
4.946
4.950
4.956
4.958
2
4.958
4.927
4.935
4.940
4.950
3
4.971
4.929
4.965
4.952
4.938
4
4.940
4.982
4.970
4.953
4.960
5
4.964
4.950
4.953
4.962
4.956
6
4.969
4.951
4.955
4.966
4.954
7
4.960
4.944
4.957
4.948
4.951
8
4.969
4.949
4.963
4.952
4.962
9
4.984
4.928
4.960
4.943
4.955
10
4.970
4.934
4.961
4.940
4.965
11
4.975...
Conversion of -3.5 x 10e-6 to fentometers?
Conversion of -3.5 x 10e-6 to fentometers?
a.) Write down all feasible samples of size 2 of the values in the following table...
a.) Write down all feasible samples of size 2 of the values in
the following table and calculate the average number of cases in
each. (Hint: There are 45 possible combinations of size 2.)
b.) Compare the average value of the distribution of sample means
with that of the population. Write what you observe.
c.) In a graph compare the dispersion of the population with that
of the sample means. Write what you observe.
Validity
Zone A
01/01/2019
$102.68
01/01/2018...
MEAN CI x-bar (Grand Mean) LCL x-bar (CI-A2*R-bar) UCL x-bar (CI+A2*R-bar) Sample Range (Max-Min) R-bar (Mean)...
MEAN
CI
x-bar
(Grand Mean)
LCL
x-bar
(CI-A2*R-bar)
UCL
x-bar
(CI+A2*R-bar)
Sample
Range
(Max-Min)
R-bar
(Mean)
UCL
R
(R-bar*D4)
1
68.51
68.46
68.54
68.34
68.46
68.46
2
68.94
68.2
68.54
68.56
68.7
68.7
3
68.66
68.44
68.55
68.77
68.7
68.64
4
68.49
68.94
68.56
68.62
68.69
68.56
5
68.64
68.63
68.62
68.32
68.34
68.24
6
68.34
68.42
68.99
68.02
68.03
68.47
7
68.99
68.94
68.95
68.95
68.94
68.97
8
68.92
68.91
68.97
68.93
68.96
68.95
GRAND MEAN
n=
A2=
D4=
Five samples of size 4 were taken from a process. Summary statistics are shown below: Sample...
Five samples of size 4 were taken from a process. Summary
statistics are shown below:
Sample Range Mean
1 1.75 10.5
2 2.42 22.3
3 2.75 17.4
4 2.04 20.1
5 2.80 18.9
What is the lower control limit for a range chart?
Use the data in the table below to set up short-run X-bar and R charts using...
Use the data in the table below to set up short-run X-bar and R
charts using the DNOM approach. The nominal dimensions for each
part are TA = 50, TB = 75, TC = 60, TD = 100, and TE = 125.
Sample
Part
M1
M2
M3
1
A
51
50
51
2
A
48
50
52
3
A
50
52
48
4
A
49
51
54
5
A
47
45
52
6
A
49
50
51
7
B
73...
The values of y and their corresponding values of y are shown in the table below...
The values of y and their corresponding values of y are shown in
the table below
x
2
3
4
4
6
y
2
3
5
4
6
A) Calculate the coefficient of correlation;
B) Calculate the coefficient of determination;
C) Obtain the regression coefficients and write the regression
expression;
D) Provide your prediction of the dependent variable if the
value of the independent variable is 4.
Using the normal probability paper shown in Table 6–3, label the x axis with the class boundaries as shown and plot the percents. Data from in Table 6-3
Using the normal probability paper shown in Table 6–3, label the x axis with the class boundaries as shown and plot the percents. Data from in Table 6-3
Consider a random sample of size n= 20 from Xi~Exp(2). Find exact P(X bar > 2.59)....
Consider a random sample of size n= 20 from Xi~Exp(2). Find exact
P(X bar > 2.59).
(Not allowed to use R)
What is the code in Rstudio or R? (a) Generate 200 random samples of size n...
What is the code in Rstudio or R?
(a) Generate 200 random samples of size n = 10 from a Poisson
distribution with mean λ = 12.
i. Calculate sample means for each sample. Report the first 10
sample means.
ii. Draw a histogram of the sample means (where the y-axis is
the density) and fit a density estimate (default density estimator
is ok).
iii. What is your finding about the sampling distribution of the
sample mean, based on your...
ADVERTISEMENT
ADVERTISEMENT
Latest Questions
- The output of the function is a dictionary whose keys represent the bins and whose values...
- The shape of a graph of a binomial distribution depends on the value of both n...
- In 2012, cost per Medicare beneficiary did what?
- 3. A. What techniques can a firm use to optimize demand deposit holdings? B. How do...
- The half-life of mercury-197 is 64.1 hours. If a patient undergoing a kidney scan is given...
- Double bonds react with Br2 to form a dibromide. Isobutylene undergoes cationic polymerization under conditions where...
- 1. Which sex chromosomes are limited to only one sex? A. X and Z B. X...
ADVERTISEMENT