Question
In: Math
Researchers conducted a study to investigate the effectiveness of two different treatments for depression (Lithium or...
Researchers conducted a study to investigate the effectiveness of two different treatments for depression (Lithium or Imipramine). A sample of individuals diagnosed with bipolar depression were divided into three groups - one group received Lithium, one group received Imipramine, and the last group was given a placebo. After a specified length of time, patients are evaluated for a recurrence of depression. Use StatCrunch to conduct a chi-square test to determine if recurrence is related to the treatment prescribed. In StatCrunch, select Stat > Tables > Contingency > With Data. Select one of the variables of interest for the row variable and the second variable as the column variable. Then click Compute.
- Select the appropriate hypotheses:
- HoHo: recurrence of depression is related to the treatment
prescribed
HaHa: recurrence of depression is not related to the treatment prescribed - HoHo: recurrence of depression is not related to the treatment
prescribed
HaHa: recurrence of depression is related to the treatment prescribed
- HoHo: recurrence of depression is related to the treatment
prescribed
- TS: χ2χ2 = (round to 4 decimal places)
- probability = (round to 4 decimal places)
- Conclusion: At the 0.10 level, there Select an answer is is not significant evidence to conclude recurrence of depression Select an answer is not is related to the treatment prescribed.
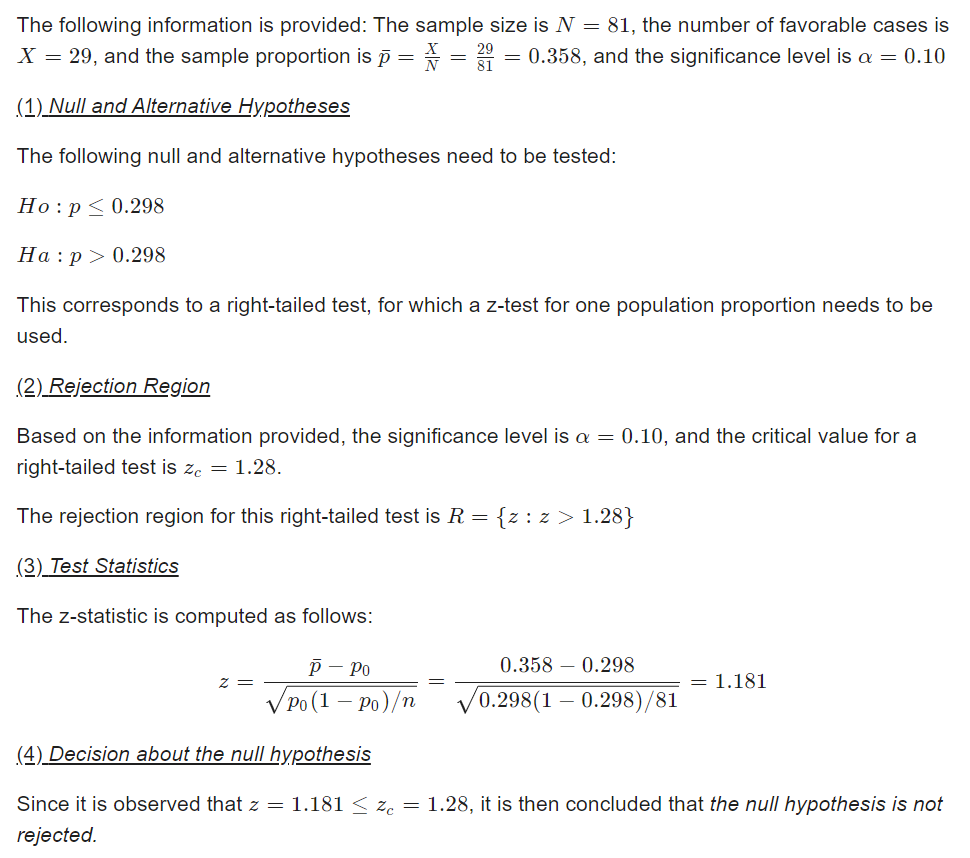
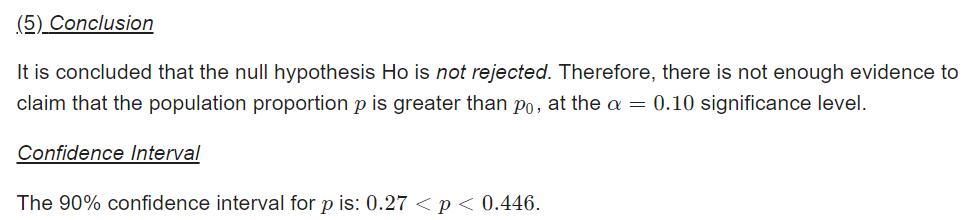
Throwback Question: Suppose we know that the risk of liver cancer among alcoholics without cirrhosis of the liver is 29.8%. A researcher conjectures that the risk of cancer among alcoholics with cirrhosis of the liver is higher. Suppose we sample 81 alcoholics with cirrhosis of the liver and determine 29 have liver cancer. Use this information to answer the following:
- For each person in the sample, what variable is recorded?
- number of years diagnosed with cirrhosis
- level of alcoholism
- percentage of individuals with liver cancer
- if the individual has liver cancer
- Completely describe the sampling distribution
for the sample proportion of alcoholics with cirrhosis who have
liver cancer when samples of size 81 are selected (assuming there
is no difference in occurrence between those with and without
cirrhosis).
- mean: μˆpμp^ =
- standard deviation: σˆpσp^ = (round to 4 decimal places)
- shape: the distribution of the sample proportion is Select an
answer not normally distributed normally
distributed
- Checks: np = and n(1 - p) =
- Test the appropriate claim using the data collected at a
significance level of 0.10.
- HoHo : p ? < > = ≠ HaHa : p ? = < > ≠
- αα =
- TS: z = (round your final answer to 2 decimal places; carry 4 decimal places throughout your calculation)
- probability = (round to four decimal places)
- Decision: Select an answer fail to reject H₀ reject H₀
- Interpretation:At the 0.10 level, there Select an answer is is not significant evidence to support the claim that the incidence rate of liver cancer is Select an answer lower higher different than in alcoholics diagnosed with cirrhosis.
Solutions
 milcah answered 6 months ago
Related Solutions
To study the effectiveness of treatments for insomnia, a health psychologist conducted a study with 12...
To study the effectiveness of possible treatments for insomnia, a sleep researcher conducted a study with...
a study was conducted to investigate the effectiveness of acupuncture in reducing pain.
A study is conducted to investigate the impact of depression on a patient’s ability to survive...
Problem: To study the effectiveness of possible treatments for insomnia, a sleep researcher conducted a study...
Treatment for depression: Researchers conducted a study of 18 patients whose depression had not responded to...
A study was conducted to investigate the effectiveness of acupuncture in reducing pain. Results for 6...
Researchers conducted a study to investigate whether there is a difference in mean PEF in children...
A study was conducted to investigate whether a new diet lowers cholesterol. The researchers took a...
Tasmanian researchers conducted a case –control study to investigate the effect of dietary fat intake on...
- sort_employees(Employee emps[], int size) (40 pts) This function should sort the input array based on each...
- Write the program in JAVA. Make an undirected, but disconnected graph of at least 15 vertices...
- Teen Smoking Project CHAPTER 0. Preliminary Discussion Question: 1. What conjectures (educated guesses) could be made...
- In reviewing firm liquidity situations, lenders often count on the Quick Ratio (or Acid-Test ratio). Why...
- code a Java program that: Requests from the user for a text filename to read the...
- Discuss how the ARIES algorithm must operate under the circumstances that the system crashes during recovery
- (a) Based on the information in the above table, what is the unemployment rate? What is...