Question
In: Math
Independent Sample T Test (Student Height) Open College Student Data Research Question: Is there a significant...
Independent Sample T Test (Student Height)
Open College Student Data
Research Question: Is there a significant difference between genders on average student height?
Record the following:
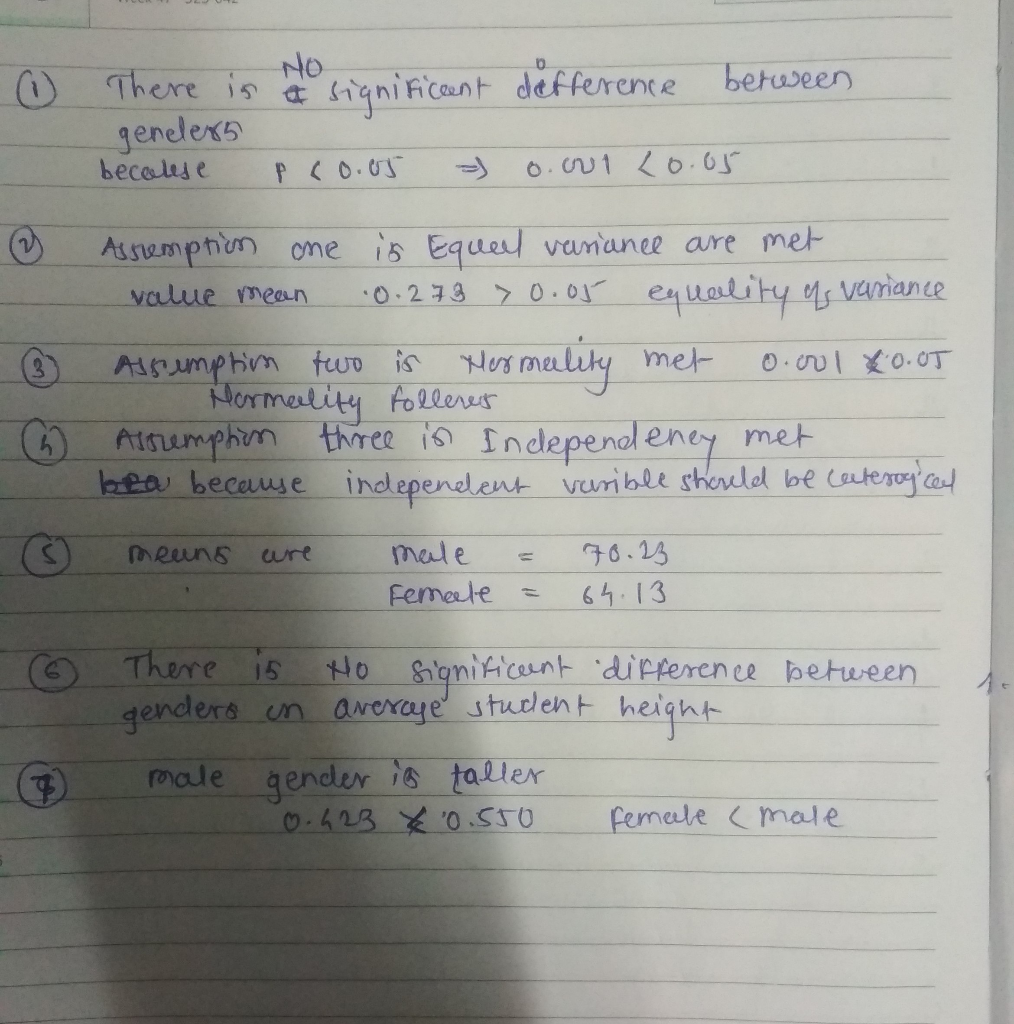
1)What test will you run to answer this research question? Why?
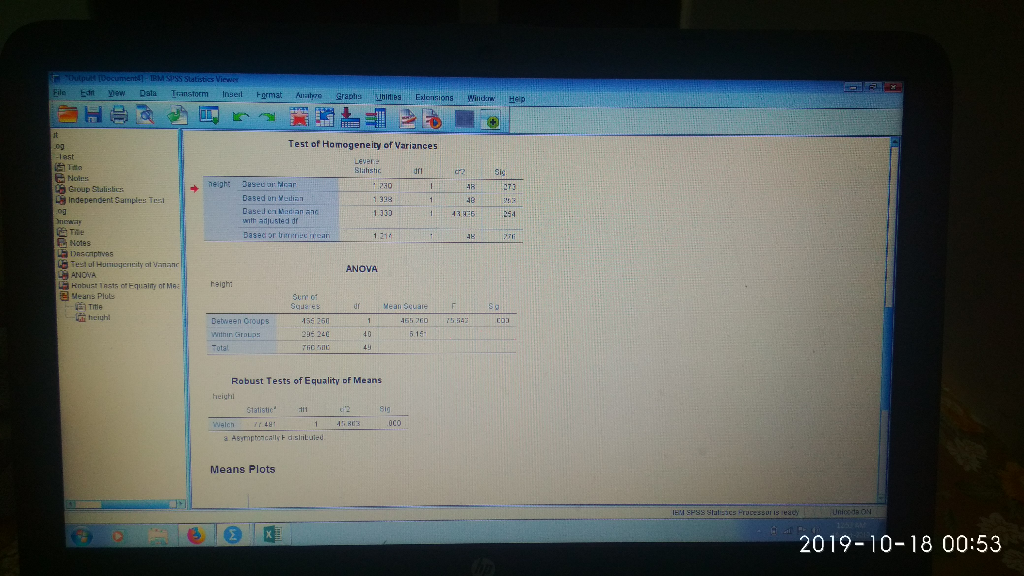
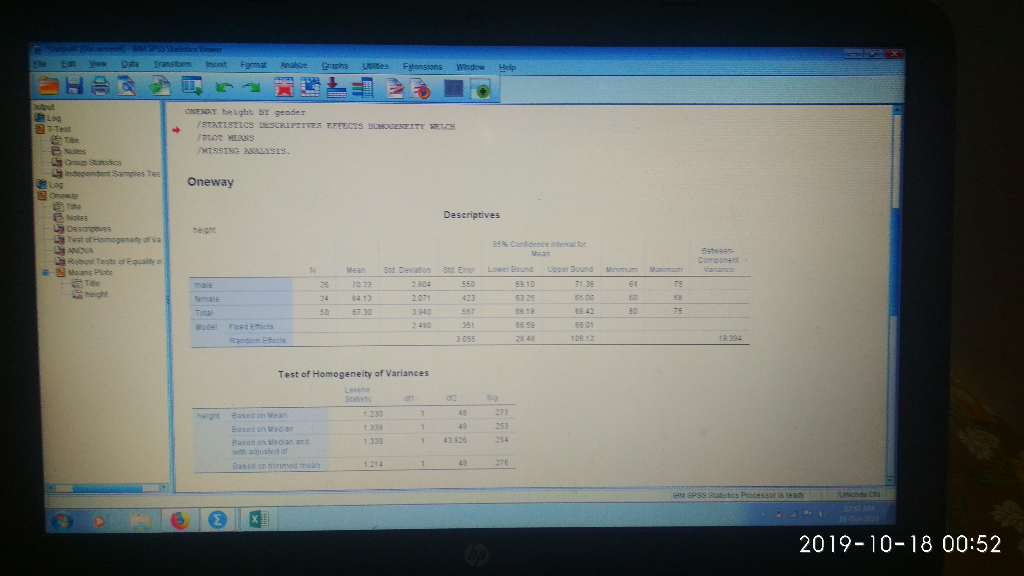
2)Is Assumption One: Equal Variances met? How do you know?
3)Is Assumption Two: Normality met? How do you know?
4)Is Assumption Three: Independency met? How do you know?
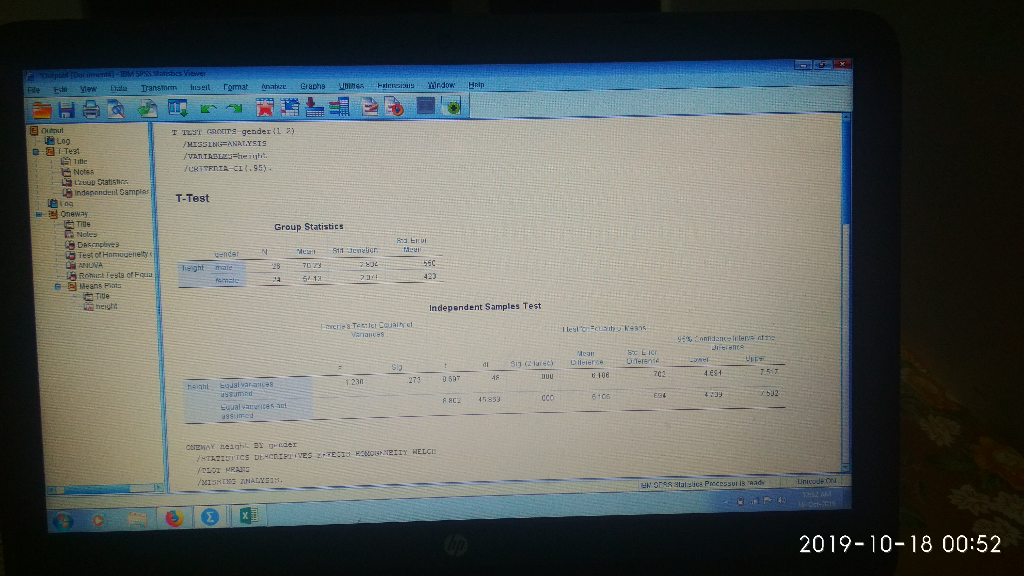
5)What are the means? (Male and Female)
6)Answer the research question. How do you know?
7)Which gender is statistically taller? How do you know?
8)Is there an effect size (Cohen’s D)? If so what is it? How did you arrive at the effect size? Is it small, medium, large or very large? How do you know?
DATA SET
height gender (1 - male, 2 - female)
67.00 2
72.00 1
61.00 2
71.00 1
65.00 2
67.00 1
69.00 1
75.00 1
62.00 2
61.00 2
64.00 2
64.00 1
70.00 1
63.00 2
64.00 2
63.00 2
65.00 2
71.00 1
72.00 1
68.00 2
75.00 1
67.00 2
69.00 1
67.00 1
64.00 2
64.00 2
70.00 1
64.00 1
70.00 1
72.00 1
64.00 2
71.00 1
67.00 2
63.00 2
69.00 1
68.00 1
64.00 2
70.00 1
71.00 1
72.00 1
60.00 2
65.00 2
72.00 1
63.00 2
75.00 1
71.00 1
65.00 2
69.00 1
63.00 2
67.00 2
Solutions
 milcah answered 5 months ago
Related Solutions
Provide an example of a two sample (independent) t test in scientific research.
2.2. Indicate which test (paired samples (ie dependent) t-test, independent two samples t-test, one-sample t-test, independent...
Identify the assumptions for a two-independent sample t test
Open Hurricanes data. Test if there is a significant difference in the death by Hurricanes and...
5. TWO (INDEPENDENT) SAMPLE T-TEST (a) Describe the independent samples t-test for two means briefly. How...
TWO (INDEPENDENT) SAMPLE T-TEST (a)Describe the independent samples t-test for two means briefly. How does it...
T-Test A research team measured 70 American men’s height. The average height of these men is...
Identify the appropriate statistical test for each research description: Single-sample z-test Single-samplet-test Independent samples t-test Related...
dentify the appropriate statistical test for each research description: Single-sample z-test Single-samplet-test Independent samples t-test Related...
Open House_Price data. Test if there is a significant difference in house prices for houses that...
- Use the internet to read more about journaling file systems such as NTFS, extfs2, and extfs3....
- Consider the quick sort algorithm. The quick sort algorithm is a divide and conquer approach which...
- Tesla 1. How to make these weaknesses into strengths? Burn through cash, high prices, bottlenecking/product delays,...
- Assignment # 12: Email Presentation Learning Objectives and Outcomes Design a PowerPoint presentation appropriate for middle...
- Identify which of the perspectives you believe is the BEST for accurately explaining human behavior and...
- What trade policies should a country adopt? why? Explain. Also, find some reference materials on this...
- In Java: Suppose you want to implement a Sudoku game that consists of 9x9 rows and...