Question
In: Math
In a USA Today article about an experimental vaccine for children the data found in the...
In a USA Today article about an experimental vaccine for children the data found in the table below was presented. Using the technique of Chi Square use a .05 significance level to test if there is an association between treatment type and outcome of flu. Does the vaccine appear to be effective? (Is there an association?)
Developed flu?
yes no
vaccine 14 656
placebo 95 137
Solutions
Expert Solution
Claim: There is an association between treatment type and outcome of flu.
The null and alternative hypothesis is
H0: There is no an association between treatment type and outcome of flu.
H1: There is an association between treatment type and outcome of flu.
Level of signfiicance = 0.05
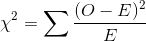
Test statistic is
O: Observed frequency
E: Expected frequency.
E = ( Row total*Column total) / Grand total
| yes | no | Total | |
| Vaccine | 14 | 656 | 670 |
| placebo | 95 | 137 | 232 |
| Total | 109 | 793 | 902 |
| O | E | (O-E) | (O-E)^2 | (O-E)^2/E |
| 14 | 80.96452 | -66.9645 | 4484.247 | 55.38534 |
| 656 | 589.0355 | 66.96452 | 4484.247 | 7.612865 |
| 95 | 28.03548 | 66.96452 | 4484.247 | 159.949 |
| 137 | 203.9645 | -66.9645 | 4484.247 | 21.98543 |
| Total | 244.93 |
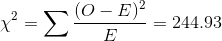
Degrees of freedom = ( Number of rows - 1 ) * ( Number of column - 1) = ( 2 - 1) * (2 - 1) = 1 * 1 = 1
Critical value = 3.841
( From chi-square table)
Test statistic > critical value we reject null hypothesis.
Conclusion: There is an association between treatment type and outcome of flu.
 milcah answered 8 months ago
Related Solutions
1. Based on the attached article that was written by Deirdre Shesgreen of the USA Today,...
1. Based on the attached article that was written by Deirdre Shesgreen of the USA Today,...
An article published in USA today stated that “in a study of colorectal surgery patients; 104...
An article published in USA today stated that “in a study of colorectal surgery patients; 104...
One of the authors came across an article (USA Today, 2008) that said that on average...
Part A: A USA Today article claims that the proportion of people who believe global warming...
A recent article in USA Today reported that a job awaits 33% of new college graduates....
Question 11 (1 point) Saved A USA Today article claims that the proportion of people who...
USA Today reported that about 47% of the general consumer population in the United States is...
USA Today reported that about 47% of the general consumer population in the United States is...
- Problem 18-12 Various shareholders' equity topics; comprehensive [LO18-1, 18-4, 18-5, 18-6, 18-7, 18-8] Part A In...
- Hello There, This is discussion Question For Advanced Database Systems Question: (a) Please define what a...
- Physicians at a clinic gave what they thought were drugs to 860860 patients. Although the doctors...
- On January 1, 2018, bonds with a face value of $ 79,000 were sold. The bonds...
- How do I make this sort in true alphabetical order instead of ascii(ABCabc) order? I am...
- As a healthcare provider in physical therapy, athletic training, or as an exercise scientist and personal...
- in the market for makeup artists, what happens after the invention of high-definition tv allowing viewers...