Question
In: Math
During a 10-year period, the standard deviation of annual returns on a portfolio you are analyzing...
- During a 10-year period, the standard deviation of annual returns on a portfolio you are analyzing was 15 percent a year. You want to see whether this record is sufficient evidence to support the conclusion that the portfolio’s underling variance of return was less than 400, the return variance of the portfolio’s benchmark.
- Formulate null and alternative hypotheses consistent with the verbal description of or objective.
- Identify the test statistics for conducting a test of the hypothesis in part A
- Identify the rejection point or point at the 0.05 significance level for the hypothesis tested in Part A
- Determine whether the null hypothesis is rejected or not rejected at the 0.05 level of significance.
please show work
Solutions
Expert Solution
Solution:
Given:
Sample Size = n = Number of years = 10
the standard deviation of annual returns on a portfolio you are analyzing was 15 percent a year.
that is : s = 15%
We have to test whether this record is sufficient evidence to support the conclusion that the portfolio’s underling variance of return was less than 400.
Part a) Formulate null and alternative hypotheses consistent with the verbal description of or objective.

Vs

Part b) Identify the test statistics for conducting a test of the hypothesis in part A
We use Chi-square test of variance:


Part c) Identify the rejection point or point at the 0.05 significance level for the hypothesis tested in Part A
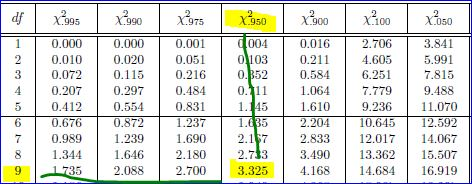
df = n - 1= 10 - 1 = 9
significance level =  = 0.05
since this is left tailed test we look for Area = 1- =
1-0.05=0.95
Thus
Chi-square critical value =3.325
Thus rejection region is:
Reject null hypothesis H0, if  test
statistic < 3.325,
test
statistic < 3.325,
otherwise we fail to reject H0.
Part d) Determine whether the null hypothesis is rejected or not rejected at the 0.05 level of significance.
Since Chi-square test statistic value =
> Chi-square critical value = 3.325, we fail to reject H0.
Thus there is NOT sufficient evidence to support the conclusion that the portfolio’s underling variance of return was less than 400
 milcah answered 9 months ago
Related Solutions
What is the (population) standard deviation of portfolio returns?
What is the standard deviation of the returns on a portfolio that is invested in stocks...
Table 2 shows regressions of the standard deviation and Sharpe ratio of household portfolio annual returns...
Table 2 shows regressions of the standard deviation and Sharpe ratio of household portfolio annual returns...
1. What is the expected standard deviation of the returns of a portfolio that is invested...
Given the following information, what is the standard deviation of the returns on a portfolio that...
With respect to performance measures, the use of the standard deviation of portfolio returns is a...
You are analyzing the returns of a mutual fund portfolio for the past 5 years. Year...
You are analyzing the returns of a mutual fund portfolio for the past 5 years. Year...
You have $1M to invest. You want to maximize returns subject to a portfolio standard deviation...
- Problem 18-12 Various shareholders' equity topics; comprehensive [LO18-1, 18-4, 18-5, 18-6, 18-7, 18-8] Part A In...
- Hello There, This is discussion Question For Advanced Database Systems Question: (a) Please define what a...
- Physicians at a clinic gave what they thought were drugs to 860860 patients. Although the doctors...
- On January 1, 2018, bonds with a face value of $ 79,000 were sold. The bonds...
- How do I make this sort in true alphabetical order instead of ascii(ABCabc) order? I am...
- As a healthcare provider in physical therapy, athletic training, or as an exercise scientist and personal...
- in the market for makeup artists, what happens after the invention of high-definition tv allowing viewers...