Question
In: Statistics and Probability
9) According to a census that was conducted five years ago, the mean annual household salary...
9)
According to a census that was conducted five years ago, the
mean annual household salary in the city of Townsburg was $40,084.
The mayor of Townsburg believes that there has been an economic
upturn in the city since then. He appoints a team to test for
evidence that the mean annual household salary in Townsburg has
increased. The teams surveys a sample of 41 households. The sample
has a mean annual salary of $40,862 with a standard deviation of
$2688.
Test for evidence that the mean annual household salary in
Townsburg has increased during the last five years. Use a level of
significance of α = 0.05.
p = 0.0356
We do not reject the null hypothesis. There is not sufficient
evidence at the 5% level of significance to suggest that the mean
annual household salary in Townsburg has increased in the last five
years.
p = 0.0712
We do not reject the null hypothesis. There is not sufficient
evidence at the 5% level of significance to suggest that the mean
annual household salary in Townsburg has increased in the last five
years.
p = 0.0712
We reject the null hypothesis. There is sufficient evidence at the
5% level of significance to suggest that the mean annual household
salary in Townsburg has increased in the last five years.
p = 0.0356
We reject the null hypothesis. There is sufficient evidence at the
5% level of significance to suggest that the mean annual household
salary in Townsburg has increased in the last five years.
p = 0.0319
We reject the null hypothesis. There is sufficient evidence at the
5% level of significance to suggest that the mean annual household
salary in Townsburg has increased in the last five years.
p = 0.0319
We do not reject the null hypothesis. There is not sufficient
evidence at the 5% level of significance to suggest that the mean
annual household salary in Townsburg has increased in the last five
years.
10)
A company produces ball bearings which have a mean diameter of
7.33 mm. After replacing some parts in their production line, the
lead engineer wants to check to see if there has been a change in
the diameters of the ball bearings being produced. A sample of 38
ball bearings is checked, resulting in a sample mean diameter of
7.27 mm with a sample standard deviation of 0.17 mm.
Test for evidence that there has been a change (in either
direction) in the mean diameter of the ball bearings. Use a level
of significance of α = 0.05.
p = 0.0180
We reject the null hypothesis. There is sufficient evidence at the
5% level of significance to suggest that their has been a change in
the mean diameter of the ball bearings.
p = 0.0148
We reject the null hypothesis. There is sufficient evidence at the
5% level of significance to suggest that their has been a change in
the mean diameter of the ball bearings.
p = 0.0360
We do not reject the null hypothesis. There is not sufficient
evidence at the 5% level of significance to suggest that their has
been a change in the mean diameter of the ball bearings.
p = 0.0148
We do not reject the null hypothesis. There is not sufficient
evidence at the 5% level of significance to suggest that their has
been a change in the mean diameter of the ball bearings.
p = 0.0360
We reject the null hypothesis. There is sufficient evidence at the
5% level of significance to suggest that their has been a change in
the mean diameter of the ball bearings.
p = 0.0180
We do not reject the null hypothesis. There is not sufficient
evidence at the 5% level of significance to suggest that their has
been a change in the mean diameter of the ball bearings.
Solutions
Expert Solution
9.
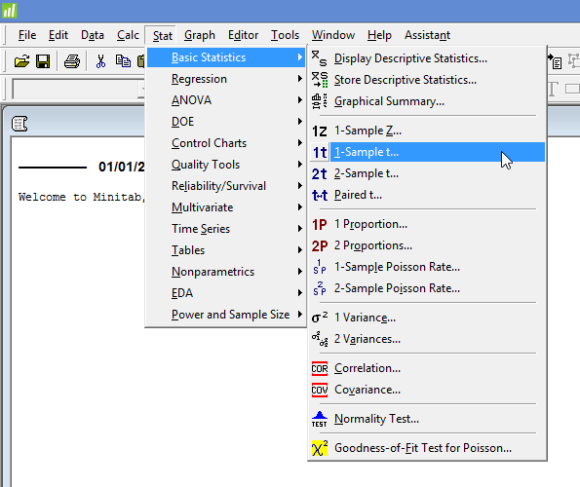
One sample t test using Minitab:
This is Right tailed test :
Click Stat > Basic Statistics > 1-Sample t... on the top menu, as shown below:
You will be presented with the following 1-Sample t (Test and Confidence Interval) dialogue box:
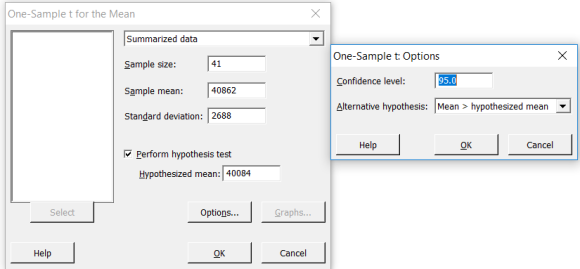
Click the OK button. The output that Minitab produces is shown below.
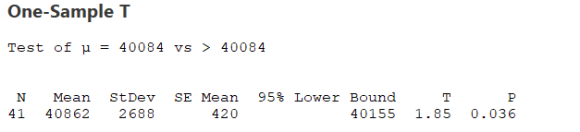
Correct Option is
p = 0.0356
We do not reject the null hypothesis. There is not sufficient
evidence at the 5% level of significance to suggest that the mean
annual household salary in Townsburg has increased in the last five
years.
Post remaining questions sapeartely. Hope this will be helpful. Thanks and God Bless You :)
 orchestra answered 3 years ago
Related Solutions
Today, you earn a salary of $75,500. What was your annual salary be five years ago...
Scenario: You conducted research on annual salary for randomly-selected college graduates five years after their graduation...
Scenario: You conducted research on annual salary for randomly-selected college graduates five years after their graduation...
You conducted research on annual salary for randomly-selected college graduates five years after their graduation dates....
According to the 2009 current Population Survey conducted by the U.S. Census Bureau, 40% of the...
According to a report, the mean of monthly cell phone bills was $49.33three years ago. A...
According to a report, the mean of monthly cell phone bills was $49.32 three years ago....
Ten years ago, the mean age of death row inmates was 50.4 according to the US...
Household Income in Maryland: According to Money magazine, Maryland had the highest median annual household income...
The consumer food database contains five variables: Annual Food Spending per Household, Annual Household Income, Non-Mortgage...
- Problem 18-12 Various shareholders' equity topics; comprehensive [LO18-1, 18-4, 18-5, 18-6, 18-7, 18-8] Part A In...
- Hello There, This is discussion Question For Advanced Database Systems Question: (a) Please define what a...
- Physicians at a clinic gave what they thought were drugs to 860860 patients. Although the doctors...
- On January 1, 2018, bonds with a face value of $ 79,000 were sold. The bonds...
- How do I make this sort in true alphabetical order instead of ascii(ABCabc) order? I am...
- As a healthcare provider in physical therapy, athletic training, or as an exercise scientist and personal...
- in the market for makeup artists, what happens after the invention of high-definition tv allowing viewers...