Question
In: Math
The class is Psychology - 223 but it's more a Statistics question... 1.I need to describe...
The class is Psychology - 223 but it's more a Statistics question...
1.I need to describe the hypothesis associated with my research scenario.
2. I need to state my understanding of what each hypotheses mean.
3. I need to identify the null and alternative hypothesis using appropriate statistical symbols and language based on what is being compared in my research scenario.
And can someone please explain to me how to use that immage up load thing that is asking for a URL on the (immage properties), I have no idea what to put in that spot.
PSY 223 Milestone Three Worksheet
Review the critical elements that must be addressed in the final project. Use this worksheet to create Milestone Three. A hypothesis is a position about research outcomes. In this assignment, you will describe two hypotheses associated with your research scenario.
Points to consider: A researcher acts like the coach of a sports team. In a pregame meeting, a coach describes the possible scenarios associated with outcomes of a game. “If we win, it means we go to the playoffs; if we lose it means our season is over.” The coach’s specificity helps ensure everyone is clear on what the team is up against and what is at stake. Before doing an analysis, researchers do something similar. They acknowledge potential outcomes of the upcoming analysis. “We can find either: (a) variation in the data reflects chance, or (b) variation in the data is due to a systematic law.” Researchers call position (a) null hypothesis (symbolized H0). Researchers call position (b) alternative hypothesis (symbolized Ha). A researcher customizes the hypotheses to a study, using symbols and information about the specific study.
1. Indicate your research hypotheses (null and alternative), incorporating the appropriate symbols. [To answer this question, you need, in part, to look at the research scenario.]
2.State what the hypotheses mean.
[Some overlap may exist with your answer to # 1. These are related rather than mutually exclusive questions.]
Scenario 2 (Forensic Psychology)
Levels of groups' certainties about their eyewitness testimony to a simulated crime were compared. The first group was set up to be "right" in its eyewitness accounts and the second group was set up to be "wrong"; the desire was to see if confidence differed across groups. Thirty-four participants were recruited from a college campus and randomly divided into two groups, both of which were shown a video of a crime scenario (length: 58 seconds) in which the perpetrator's facial characteristics (with respect to the camera) were clearly visible at two separate points and sporadically visible at others. Half the participants then were shown a five-individual lineup that contained the perpetrator in the video ("Group A"), and half the participants were shown a five-individual lineup that did not contain the perpetrator ("Group B"). Participants were asked to (a) identify if and where the perpetrator was in the lineup and (b) provide a rating of confidence on a scale from 1 to 10 (10 being highly confident) that the selection was the same as the person seen in the video committing the crime. All participants signed consent forms, were told they could leave the study at any time, and were told they would be debriefed. Data on the confidence ratings are shown below (also found in the Data Set Scenario 2 Excel file).
Group A Confidence Group B Confidence
07 10
10 05
09 05
10 10
08 07
05 06
10 10
10 09
01 03
10 06
05 04
06 10
07 10
06 10
04 03
05 07
10 08
.
Solutions
Expert Solution
Let  be the true average confidence of group A and
  be the true average confidence of group B.
The desire was to see if confidence differed
across groups. That means the desire is to see if the mean
confidence of group A is different from mean confidence of group B.
That is the desire is to test if 
Paraphrasing, we want to test if the mean confidence of the first group (group A) that was set up to be "right" in its eyewitness accounts differs from the mean confidence of the second group that was set up to be "wrong", about their eyewitness testimony.
1) We want to test the following hypotheses
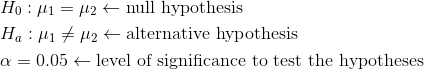
2) If the null hypothesis ture it means that there is no significant difference in the mean confidence levels of group A and group B. that means That means confidence does not differ across groups.
If the alternative hypothesis ture, it means that there is a statistically significant difference in the mean confidence levels of group A and group B. That means confidence differs across groups.
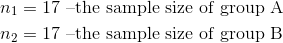
Since there are 2 groups of samples studied, we will use independent sample analysis.
We know the following information from the sample of 34 participants (17 in each group)
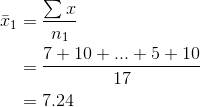 is the sample mean of group A
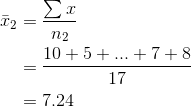 is the sample mean of group B
The sample variance of group A is
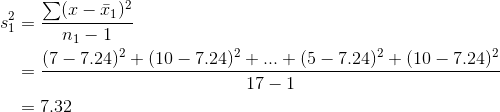
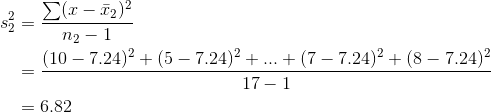
The sample variance of group B is
Let us assume that the confidence scores of 2 groups are
normally distributed. Further we will assume that the population
variance of the scores are the same, that is 
Since we do not know the population variances we need to estimate them using the sample variances.
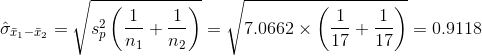
the pooled estimate of population variance is below

Finally we estimate the standard error of the difference between 2 sample means
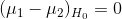
The hypothesized difference in the mean confidence is
Now the test statistics. Since the sample sizes of each group are less than 30, and we do not know the population variance of the scores (we used a pooled estimate), this is a small sample analysis.
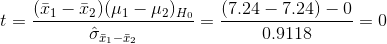
The test statistics is
The degrees of freedom of the t statistics is 
This is a 2 tailed test (the alternative hypothesis has a not equal to sign).
The critical value for significance level alpha = 0.05 is
obtained by 
From the t tables we can get the critical value as  (the closest available df in the table is 30)
We will reject the null hypothesis if the sample statistics is greater than the critical value.
We can see that the sample statistics is 0, and it is less than the critical value, 2.042.
Hence we do not reject the null hypothesis.
We conclude that there is no sufficient evidence to support the claim that confidence differs across groups.
That means confidence of first group that was set up to be "right" in its eyewitness accounts does not significantly differ from the confidence of second group that was set up to be "wrong".
 milcah answered 2 years ago
Related Solutions
I need to the analyzing this question using Statistics They way our country spends more money...
QUESTION 13 Psychology Final Question 1 A professor teaches two sections of a Psychology class. The...
I need Answers to Question from P - V! I know it's a lot but they...
Question 1 Define psychology and then describe its goals. Describe 1 psychology research method
I need an answer only for the bold part of the question. 1. Circle: The class...
I need a good topic for the Quality Improvement Report, it's for my operational management class....
Subject: artificial intelligence. Clear answer with example. I need it long enough it's an assignment. QUESTION:1 --...
Psychology Class Question Many would consider it ironic that men are more likely than women to...
this is a question for marketing class, i need to know out of all of the...
Trying this one again too... it's a completely different question, I need to know how to...
- . 1. Provide an example of any two leading companies from the same industry, which are...
- Suppose Elon Musk is spectacularly successful, and electric vehicle technology follows the technology diffusion model we’ve...
- Starting from rest, a basketball rolls from the top to the bottom of a hill, reaching...
- Ray Company provided the following excerpts from its Production Department’s flexible budget performance report. (Round "rate...
- Give an examples of Altruism on a macro level, and micro level, and how the concept...
- QUESTION In process improvement efforts, quality costs or cost of quality is a means to quantify...
- Lightning is a great illustration from nature of the stunning application of statics and electric fields....