Question
In: Accounting
Why is ROE net income/ average stockholders equity but my Professor told us about the Basic...
Solutions
Expert Solution
ROE – Return on Equity: ROE can be basically considered as profitability ratio from shareholder’s point of view. This provides how much returns on generated from shareholder’s investments, not from the overall company investments in assets.
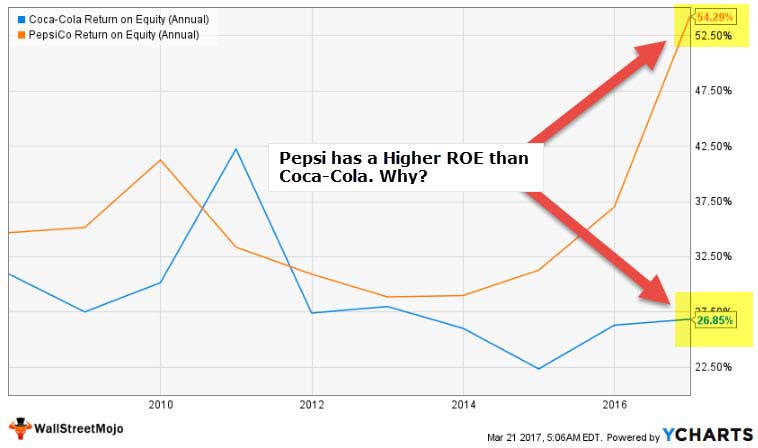
We note from the above chart that Return on Equity or ROE of Pepsi is better than that of Coca-Cola. Why?
In order to answer this question, most analysts use Dupont Return on Equity formula and find out Profit Margin, Asset Turnover and Equity Multiplier (Financial Leverage). But how they are connected and why does it matters?
This in-depth article on ROE and Dupont Return on Equity answers this question and covers the following topics –
- What is ROE & DuPont Return on Equity ?
- Return on Equity & DuPont ROE Formula
- Interpretation of ROE & DuPont ROE
- ROE & DuPont ROE Example
- Return on Equity Example # 1
- ROE Example # 2
- Calculate Return on Equity & DuPont ROE of Nestle
- Colgate’s ROE and Dupont Return on Equity calculation
- Return on Equity of Soft Drink Sector
- Return on Equity of Automobile Sector
- Return on Equity of Discount Stores
- Return on Equity of Engineering & Construction Companies
- Return on Equity of Internet Companies
- Return on Equity of Oil & Gas Companies
- Limitations of ROE & DuPont ROE
WHAT IS RETURN ON EQUITY & DUPONT ROE?
ROE is a simple equation which spells as Return on Equity. But when we use DuPont Analysis then things change. Why does it change? Because even if DuPont Analysis will result in the similar ratio (i.e. ROE), it takes help of few ratios put together to understand the financial affairs of the company better.
Let’s say that you know that a company’s net revenue is more than another company. Now if you base your analysis only on ROE, then it may not give you the right answer. You may need to dig deeper and find out what’s working for the company and what’s not. That’s the reason DuPont analysis is so very important.
Back in 1914, Mr. F Donaldson Brown joined DuPont Corporation in the treasury department. At that time DuPont acquired a percentage of stake in General Motors and he was given the responsibility to take DuPont out of financial mess. So he tried certain methods of analyses which seemed useful. And that analysis has been named DuPont Analysis.
Recommended Courses
- Financial Analyst Prep Training
- Professional Investment Banking Training
- Equity Research Training
ROE Video
ROE & DUPONT ROE FORMULA
We will look at the whole formula.
First, let’s look at the formula of Return on Equity (ROE) –
Return on Equity Formula = Net Income / Total Equity
Now, let’s look at Return on Equity from a different point of view.
If we look at Return on Equity in a different way, we will get this –
DuPont ROE Formula = (Net Income / Net Sales) x ( Net Sales / Total Assets) x Total Assets / Total Equity
DuPont Return on Equity Formula = Profit Margin * Total Asset Turnover * Equity Multiplier
Now you can understand that they all are separate ratios. If you are wondering how come we have come to the conclusion that if we multiply these three ratios we will get return on equity, here’s how we have reached the conclusion.
- Profit Margin = Net Income / Net Sales
- Total Asset Turnover = Net Sales / Average Total Assets (or Total Assets)
- Equity Multiplier = Total Assets / Total Equity
Now, let’s put them together and see whether we get the return on equity or not –
(Net Income / Net Sales * Net Sales / Average Total Assets * Total Assets / Total Equity
If we look closely, we will see that by multiplying all these three ratios, we end up with just Net Income / Total Equity.
So we come to the conclusion that if we use these three ratios and multiply them we would get Return on Equity.
INTERPRETATION OF ROE & DUPONT ROE
ROE is always useful. But to those investors who want to find out the “why” behind the current ROE (high or low), they need to use DuPont analysis to pinpoint where is the actual problem lies and where the firm has done well in.
In DuPont model, we can look at three separate ratios by comparing which they can come to the conclusion whether it’s wise for them to invest into the company or not.
For example, if in equity multiplier if we find out that the firm is more dependent on the debt rather than equity, we may not invest into the company because that may become a risky investment.
On the other hand, by using this DuPont model you would be able to pare down the chances of losses by looking at profit margin and asset turnover and vice versa.
ROE & DUPONT RETURN ON EQUITY EXAMPLE
In this section, we will take two examples. The first example is the easier one and the second example would be a bit complex.
Let’s jump in and see the examples right away.
RETURN ON EQUITY EXAMPLE # 1
Let’s look at two firms A and B. Both of these companies operate in the same apparel industry and most astonishingly both of their Return on Equity (ROE) is 45%. Let’s look at the following ratios of each company so that we can understand where the problem lies (or opportunity) –
| Ratio | Firm A | Firm B |
| Profit Margin | 40% | 20% |
| Total Asset Turnover | 0.30 | 5.00 |
| Equity Multiplier | 5.00 | 0.60 |
Now let’s look at each of the firms and analyze.
For Firm A, the profit margin is great, i.e. 40% and the financial leverage is also quite good, i.e. 4.00. But if we look at the total asset turnover, it’s much less. That means Firm A is not able to utilize its assets properly. But still, due to the other two factors, the Return on Equity is higher (0.40 * 0.30 * 5.00 = 0.60).
For Firm B, the profit margin is much lower, i.e. just 20% and the financial leverage is very poor i.e. 0.60. But the total asset turnover is 5.00. Thus, for higher asset turnover, Firm B has performed well in the overall sense of Return on Equity (0.20 * 5.00 * 0.60 = 0.60).
Now imagine what would happen if the investors would only look at the Return on Equity of both these firms, they would only see that the ROE is quite good for both of the firms. But after doing DuPont analysis, the investors would get the actual picture of both of these firms.
RETURN ON EQUITY EXAMPLE # 2
At the of the year, we have these details about two companies –
| In US $ | Company X | Company Y |
| Net Income | 15,000 | 20,000 |
| Net Sales | 120,000 | 140,000 |
| Total Assets | 100,000 | 150,000 |
| Total Equity | 50,000 | 50,000 |
Now if we directly calculate the Return on Equity from the above information, we would get –
| In US $ | Company X | Company Y |
| Net Income (1) | 15,000 | 20,000 |
| Total Equity (2) | 50,000 | 50,000 |
| Return on Equity (1 / 2) | 0.30 | 0.40 |
Now using the DuPont Analysis, we would look at each of the component (three ratios) and find out the real picture of both of these companies.
Let’s calculate the profit margin first.
| In US $ | Company X | Company Y |
| Net Income (3) | 15,000 | 20,000 |
| Net Sales (4) | 120,000 | 140,000 |
| Profit Margin (3 / 4) | 0.125 | 0.143 |
Now, let’s look at total asset turnover.
| In US $ | Company X | Company Y |
| Net Sales (5) | 120,000 | 140,000 |
| Total Assets (6) | 100,000 | 150,000 |
| Total Asset Turnover (5 / 6) | 1.20 | 0.93 |
We will now calculate the last ratio i.e. financial leverage of both the companies.
| In US $ | Company X | Company Y |
| Total Assets (7) | 100,000 | 150,000 |
| Total Equity (8) | 50,000 | 50,000 |
| Financial Leverage (7 / 8) | 2.00 | 3.00 |
Using DuPont analysis, here’s the ROE for both of the companies.
| In US $ | Company X | Company Y |
| Profit Margin (A) | 0.125 | 0.143 |
| Total Asset Turnover (B) | 1.20 | 0.93 |
| Financial Leverage (C) | 2.00 | 3.00 |
| Return on Equity (DuPont) (A*B*C) | 0.30 | 0.40 |
If we compare each of the ratios, we would be able to see the clear picture of each of the company. For Company X and Company Y, financial leverage is the strongest points. For both of them, they have a higher ratio in financial leverage. In the case of profit margin, both of these companies have a lesser profit margin, even less than 15%. The asset turnover of Company X is much better than Company Y. So when investors would use DuPont, they would be able to understand the pressing points of the company before investing.
CALCULATE RETURN ON EQUITY & DUPONT ROE OF NESTLE
Let’s look at the income statement and balance sheet of Nestle and then we will compute the ROE and ROE using DuPont.
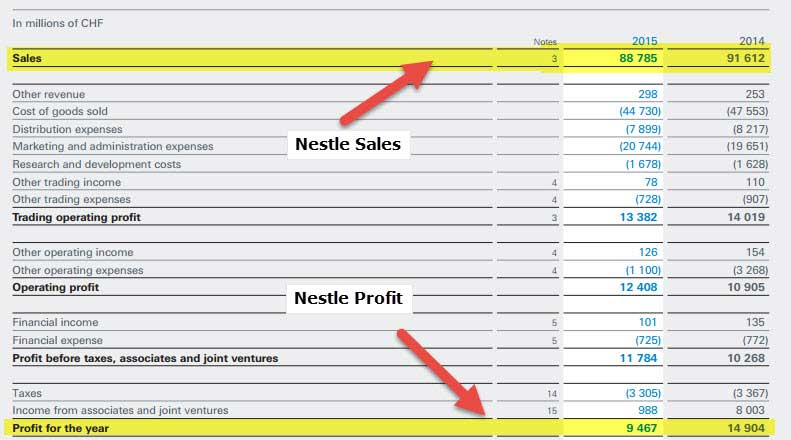
Consolidated income statement for the year ended 31st December 2014 & 2015
Consolidated balance sheet as at 31st December 2014 & 2015
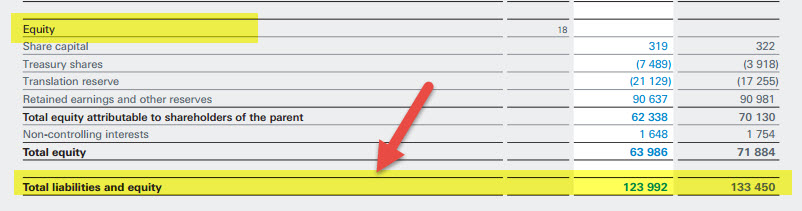
Source: Nestle.com
- ROE = Net Income / Sales
- Return on Equity (2015) = 9467 / 63986 = 14.8%
- Return on Equity (2014) = 14904 / 71,884 = 20.7%
Now we would use DuPont analysis to calculate Return on Equity for 2014 and 2015.
| In millions of CHF | 2015 | 2014 |
| Profit for the year (1) | 9467 | 14904 |
| Sales (2) | 88785 | 91612 |
| Total assets (3) | 123992 | 133450 |
| Total Equity (4) | 63986 | 71884 |
| Profit Margin (A = 1/2) | 10.7% | 16.3% |
| Total Asset Turnover (B = 2/3) | 0.716x | 0.686x |
| Equity Multiplier (C = 3/4) | 1.938x | 1.856x |
| Return on Equity (A*B*C) | 14.8% | 20.7% |
As we note from above that basic ROE formula and DuPont Formula provides us with the same answer. However, DuPont analysis helps us in analysing the reasons why there was an increase or decrease in ROE.
For example, for Nestle, Return on Equity decreased from 20.7% in 2014 to 14.8% in 2015. Why?
DuPont Analysis helps us find out the reasons.
We note that Nestle’s Profit Margin for 2014 was 16.3%, however, it was 10.7% in 2015. We note that this is a huge dip in profit margin.
Comparatively, if we look at other components of DuPont, we do not see such substantial differences.
- Asset Turnover was 0.716x in 2015 as compared to 0.686x in 2014
- Equity Multiplier was at 1.938x in 20.15 as compared to 1.856x in 2014.
There we conclude that the decrease in profit margin has led to the reduction of ROE for Nestle.
PURPOSE OF DEBT TO EQUITY RATIO IS
TO THE REPAYMENT CAPABILITY OF FIRM,,
IT GIVES THE PERCENATAGE BACKED BY OWNERS
 ekkarill92 answered 2 years ago
Related Solutions
Holding assets constant, when debt decreases Net income increases and Stockholders' equity declines Net income and...
There are 4 Basic Financial Statements: Income Statement, Balance Sheet, Statement of Changes in Stockholders/Owner’s Equity,...
Prepare the stockholders’ equity section as of April 30, 2020. Net income for the first 4 months of 2020 was $130,000.
this is my matlab code for class, my professor commented "why is the eps an input...
Why should stockholders care about maximizing firm value rather than just the value of the equity?...
Why does times-interest-earned use operating income, but the return on equity uses net income instead of...
Why does NADH have a higher metabolic efficiency than FADH2? My professor said something about NADH...
My professor asked us if the least square estimated regression equation is indeed the best unique...
My introduction to taxation professor changed the grading scale without notifying us. The syllabus has not...
im doing a media Guide poject for my SMT class. The professor wants us to use...
- Hello There, This is discussion Question For Advanced Database Systems Question: (a) Please define what a...
- Physicians at a clinic gave what they thought were drugs to 860860 patients. Although the doctors...
- On January 1, 2018, bonds with a face value of $ 79,000 were sold. The bonds...
- How do I make this sort in true alphabetical order instead of ascii(ABCabc) order? I am...
- As a healthcare provider in physical therapy, athletic training, or as an exercise scientist and personal...
- in the market for makeup artists, what happens after the invention of high-definition tv allowing viewers...
- 10. What are the three monetary policy tools of the Fed? Briefly describe how each tool...