Question
In: Statistics and Probability
What types of information can the visual display of data provide to researchers? Include examples to...
What types of information can the visual display of data provide to researchers? Include examples to support your response.
Solutions
Expert Solution
Data visualization is the presentation of data in a pictorial or graphical format. It enables decision makers to see analytics presented visually, so they can grasp difficult concepts or identify new patterns. With interactive visualization, you can take the concept a step further by using technology to drill down into charts and graphs for more detail, interactively changing what data you see and how it’s processed.
Visual displays help in the presentation of inferences and conclusions and represent ways of organizing, summarizing, simplifying, or transforming data. Data displays such as matrices and networks are often utilized to enhance data analysis and are more commonly seen in quantitative than in qualitative studies.
Data visualization can also:
- Identify areas that need attention or improvement.
- Clarify which factors influence customer behavior.
- Help you understand which products to place where.
- Predict sales volumes
Examples:
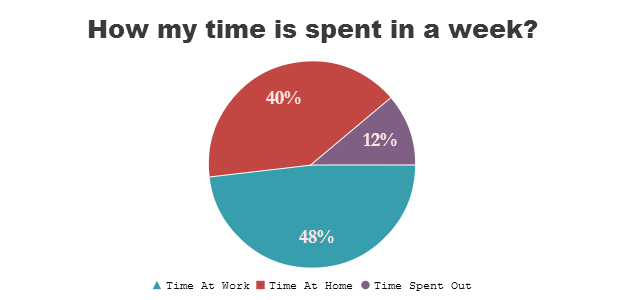
- Pie-Chart can be used to plot the way I spend my time in a
day.
- Scatter Plot can be used to check the relation between
temperature and no. of ice-cream customers.

- Line graphs are used to track changes over short and long periods of time. When smaller changes exist, line graphs are better to use than bar graphs. Line graphs can also be used to compare changes over the same period of time for more than one group. Example: a finance department may plot the change in the amount of cash the company has on hand over time.
- Area graphs are very similar to line graphs. They can be used to track changes over time for one or more groups. Area graphs are good to use when you are tracking the changes in two or more related groups that make up one whole category. Example: In the area chart of the exam scores, you can see that the scores are generally increasing over time even without knowing the exact scores on any single exam.

 orchestra answered 3 years ago
Related Solutions
What is nonparametric statistics? Provide an examples of a research hypothesis where researchers can use nonarametric...
There are different types of software’s that utilize geographic data for display of spatial information in...
What types of information can variance analysis provide to the manager? How can it be used?...
what are the two types of discourse? what are the two types of argument? provide examples
describe benefits of using visual display to present financial information in financial reporting.
explain different types of switches and scanning and provide examples of when they can be used...
Provide at least 4 examples of different types of SQL injection that can occur and the...
Explain what is meant by the visual pathway. Include in your description of the visual pathway...
create a Visual Basic project with the following features: 1. The user interface can display the...
What is a solid solution and what are the common types encountered in metals? Provide examples...
- Question 3 (a) What do you understand by a time series forecasting approach? Describe each of...
- 1 Which of the following overflow values clips all content that extends beyond the containing element’s...
- What are the key environmental and biological controls over decomposition rate in ecosystems?
- describe why independent oversight is important to taxpayers.
- Graph a Monopoly. Compare the price, quantity, and ATC of a monopoly with a perfectly competitive...
- Problem 18-12 Various shareholders' equity topics; comprehensive [LO18-1, 18-4, 18-5, 18-6, 18-7, 18-8] Part A In...
- Hello There, This is discussion Question For Advanced Database Systems Question: (a) Please define what a...