Question
In: Statistics and Probability
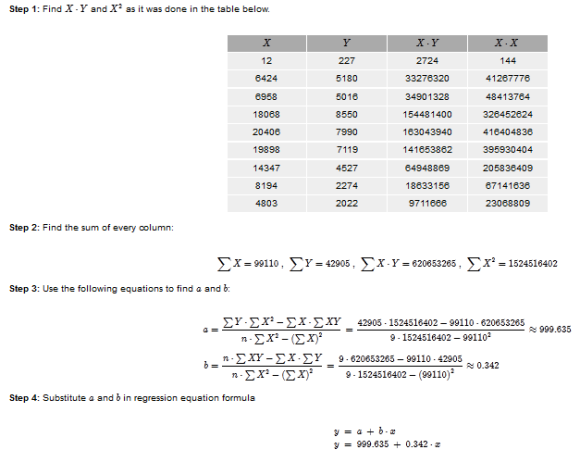
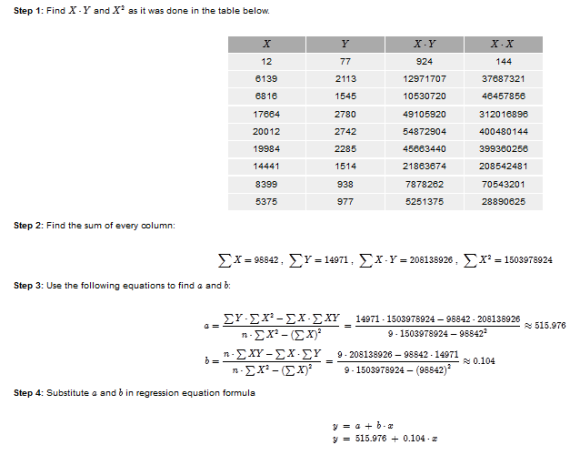
The data in the table represent the number of licensed drivers in various age groups and...
The data in the table represent the number of licensed drivers in various age groups and the number of fatal accidents within the age group by gender. Complete parts (a) to (c) below.
LOADING...
Click the icon to view the data table.
<_16 12 227
12 77
16-20 6424 5180
6139 2113
21-24 6936 5016
6816 1537
25-34 18068 8587
17664 2780
35-44 20406 7990
20048 2742
45-54 19898 7138
19984 2285
55-64 14324 4527
14441 1514
65-74 8194 2274
8376 938
>_74 4803 2022
5375 957
(a) Find the least-squares regression line for males treating the number of licensed drivers as the explanatory variable, x, and the number of fatal crashes, y, as the response variable. Repeat this procedure for females.
(b) Interpret the slope of the least-squares regression line for each gender, if appropriate. How might an insurance company use this information?
What is the correct interpretation of the slope of the least-squares regression line for males? Select the correct choice below and, if necessary, fill in the answer box to complete your choice.
(c) Was the number of fatal accidents for 16 to 20 year old males above or below average? Was the number of fatal accidents for 21 to 24 year old males above or below average? Was the number of fatal accidents for males greater than 74 years old above or below average? How might an insurance company use this information? Does the same relationship hold for females?
Solutions
Expert Solution
(a)
1. Least square regression line for males is y = ???x+ ???
2. Least square regression line for females is y = ???x+ ???
(b) (1) If the number of male licensed drivers increases by 1 (thousand), then the number of fatal crashes increases by 0.342 on average. (round to 4 decimals)
------------------------------------------------------------------------------------------------------------------------------
(b2)
(2) If the number of female licensed drivers increases by 1
(thousand), then the number of fatal crashes increases by 0.104 on
average.
------------------------------------------------------------------------------------------------------------------------------
(c) The slope of the regression line for males is greater than as that for females. This means that males tend to be involved in (more fatal as females. An insurance company may use this information to argue for ???.
------------------------------------------------------------------------------------------------------------------------------
(c2) The number of fatal accidents for 16 to 20 year old males was (abovbe average/below average).The number of fatal accidents for 21 to 24 year old males was (above avergae/below average). The number of fatal accidents for males greater than 74 years was (above avergae/below average).
------------------------------------------------------------------------------------------------------------------------------
(c3) Does the same relationship hold true for females?
Yes.
 orchestra answered 3 years ago
Related Solutions
The data in the table represent the number of licensed drivers in various age groups and...
The table shows the percentage of drivers for the entire U.S. population for different age groups....
The average age for licensed drivers in a county is 42.6, with a standard deviation of...
The data below represent the ages of drivers and the number of accidents reported for ...
Below are data for the number of students in each of four age groups that are...
The data in the table represent the weights of various domestic cars and their miles per...
The data in the table represent the weights of various domestic cars and their miles per...
The data in the table represent the number of pods on a random sample of soybean...
The average age for licensed drivers in a county is m = 42.6, s = 12 and the distribution is approximately normal.
The data represent the age of world leaders on their day of inauguration. Find the five-number...
- Two 10-cm-diameter charged rings face each other, 15cm apart. The left ring is charged to -29nC...
- Under what conditions would it be possible for an excise tax to have no efficiency cost...
- explain the difference between activities and financial statements of service businesses and merchandising businesses.
- 2. Compare and compare the matrix multiplication algorithm and the Floyd-Warshall algorithm to find all pairs...
- Q: 50.00 ml of 0.5216 M copper(II) nitrate solution is combined with 100.0 ml of 0.5580...
- This is a business law question. Explain how environmental laws regulate the use of toxic substances...
- A sky diver and her parachute system weigh a total of 800 N. She is falling...