Question
In: Statistics and Probability
Standard Normal Distribution: Assume that a randomly selected subject is given a bone density test. Those...
Standard Normal Distribution: Assume that a randomly selected subject is given a bone density test. Those test scores are normally distributed with a mean of 0 and a standard deviation of 1.
In each case, draw a graph, then find the probability of the given bone density test scores. both problems below.
a: Less than 1.35
b: Greater than 0.25
will givegreat comments and feedback just need help (:
Solutions
Expert Solution
The test scores are normally distributed with a mean of 0 and a standard deviation of 1
Mean =  = 0
= 0
Standard deviation =  = 1
= 1
We find the probability of the given bone density test scores
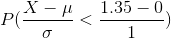
a: Less than 1.35
X = 1.35
We have to find the following probability
 --------(1)
We convert above X into z using following formula
 ---------(2)
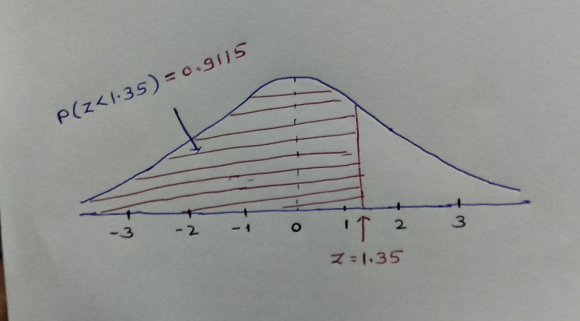
Using equation (2) in equation (1)

We find above probability using z table of standard normal curve areas
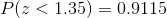
We draw a graph of above probability
are as below
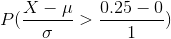
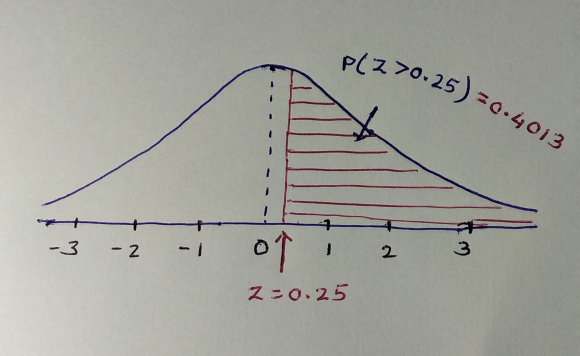
b: Greater than 0.25
X = 0.25
We have to find the following probability
 --------(3)
We convert above X into z using following formula
---------(4)
Using equation (4) in equation (3)

We find above probability using z table of standard normal curve areas

We draw a graph of above probability
are as below
Summary :-
a: Less than 1.35 that is
b: Greater than 0.25 that
is
 orchestra answered 3 years ago
Related Solutions
Assume that a randomly selected subject is given a bone density test. Those test scores are...
Assume that a randomly selected subject is given a bone density test. Those test scores are...
assume that a randomly selected subject is given a bone density test. those test scores are...
6.1 16. ASSUME THAT A RANDOMLY SELECTED SUBJECT IS GIVEN A BONE DENSITY TEST. THOSE TEST...
Assume that a randomly selected subject is given a bone density test. Bone density test scores...
Assume that a randomly selected subject is given the same bone density test. Bone density test...
Assume that a randomly selected subject is given a bone density test. Those test scores are normally distributed with a...
Assume that a randomly selected subject is given a bone density test. Those test scores are normally distributed with a mean of 0 and a standard deviation of 1.
1. Bone Density Test A bone mineral density test is used to identify a bone disease....
Find the area of the shaded region. The graph depicts the standard normal distribution of bone density scores with mean 0 and standard deviation 1.
- Write a memo by answering following questions. Overview: Identify a current topic impacting financial statements or...
- Based on what you learned in this module, identify one person who you believe possesses primarily...
- An Auditor may decide to make use of a specialist in obtaining sufficient appropriate audit evidence...
- Dirac's Theorem states that "A simple graph with n vertices (n >= 3) is Hamiltonian if...
- Two 10-cm-diameter charged rings face each other, 15cm apart. The left ring is charged to -29nC...
- Under what conditions would it be possible for an excise tax to have no efficiency cost...
- explain the difference between activities and financial statements of service businesses and merchandising businesses.