Question
In: Statistics and Probability
Assume that a randomly selected subject is given a bone density test. Those test scores are normally distributed with a mean of 0 and a standard deviation of 1.
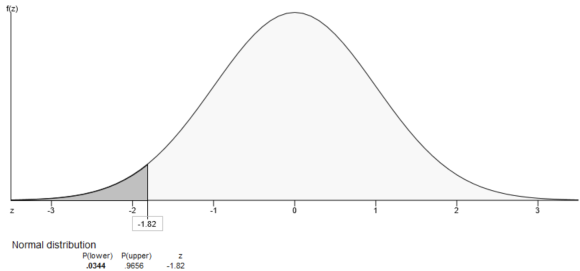
Assume that a randomly selected subject is given a bone density test. Those test scores are normally distributed with a mean of 0 and a standard deviation of 1. Find the probability that a given score is less than -1.82 and draw a sketch of the region.
Assume the readings on thermometers are normally distributed with a mean of 0degrees C and a standard deviation of 1.00degrees C. Find the probability that a randomly selected thermometer reads greater than -1.11 and draw a sketch of the region.
If you could explain how to use the normal distribution table that would be great.
Solutions
Expert Solution
Concepts and reason
Normal distribution: Normal distribution is a continuous distribution of data that has a bell-shaped curve. The \((\mu)\)
normally distributed random variable \(x\) has mean \(^{(\mu)}\) and standard deviation \((\sigma)\). Also, the standard normal distribution represents a normal curve with mean 0 and standard deviation \(1 .\) Thus, the
parameters involved in a normal distribution are mean \((\mu)_{\text {and }}\) standard deviation \((\sigma)\) Standardized z-score: The standardized z-score represents the number of standard deviations the data point is away from the mean.
If the z-score takes a positive value when it is above the mean (0).
If the z-score takes a negative value when it is below the mean (0).
Assumption of Normality:
If the data is large or greater than 30 observations, then it follows the normal distribution with parameter mean \((\mu) \) and standard deviation \((\sigma)\).
Fundamentals
Continuous probability distribution: Normal distribution (P was given z) Excel add-in (MegaStat) procedure:
1.In EXCEL, Select Add-Ins > MegaStat > Probability.
2.Choose Continuous probability distributions.
3.Select Normal distribution and select calculate P given z and enter z as
4.Enter mean as \(_{----}\) and standard deviation as \(_{---}\).
5. Click Ok.
(1.1) The probability that a given score is less than -1.82 is obtained, as shown below:
From the given information, let the random variable \(X\) be the test scores follows the normal distribution with the population mean as 0 and standard deviation as \(1 .\) The score is less than -1.82.
Instructions to obtain the probability that a given score is less than -1.82 :
1.In EXCEL, Select Add-Ins > MegaStat > Probability.
2.Choose Continuous probability distributions.
3.Select Normal distribution and select calculate P given z and enter z as -1.82.
4.Enter mean as 0 and standard deviation as 1 s.
5.Click Ok.
Follow the above instructions to obtain the following output,

From the output, the probability that a given score is less than -1.82 is 0.0344. That is, \(P(X<-1.82)=0.0344\)
Part 1.1 The probability that a given score is less than -1.82 is \(0.0344 .\)
(1.2)
The probability that a given score is less than -1.82 sketch is drawn, as shown below:
Follow the above instructions to obtain the following output,
From the output, the probability that a given score is less than -1.82 is 0.0344. That is, \(P(X<-1.82)=0.0344\)
Part 1.2
The probability that a given score is less than –1.82 is 0.0344.
(1.3)
The probability that a randomly selected thermometer reads greater than -1.11 is obtained, as shown below:
From the given information, the score is greater than \(-1.11 .\) Instructions to obtain the probability that a randomly selected thermometer reads greater than -1.11:
1.In EXCEL, Select Add-Ins > MegaStat > Probability.
2.Choose Continuous probability distributions.
3.Select Normal distribution and select calculate P given \(z\) and enter \(z\) as \(-1.11 .\)
4.Enter mean as 0 and standard deviation as 1 s.
5. Click Ok.
Follow the above instructions to obtain the following output,
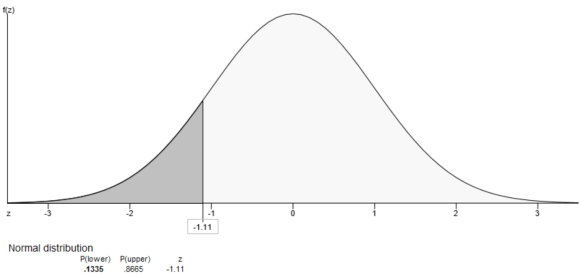
From the output, the probability that a randomly selected thermometer reads greater than -1.11 is \(0.8665 .\) That is, \(P(X>-1.11)=0.8665\)
Part 1.3 The probability that a randomly selected thermometer reads greater than -1.11 is \(0.8665 .\)
(1.4)
The probability that a randomly selected thermometer reads greater than -1.11 sketch is drawn, as shown below:
Follow the above instructions to obtain the following output,
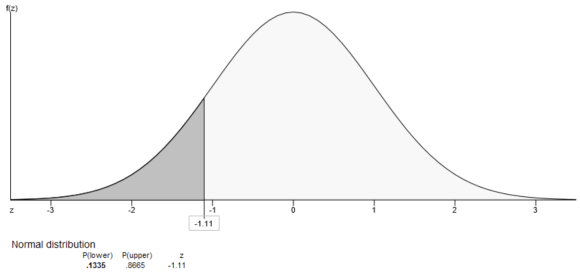
From the output, the probability that a randomly selected thermometer reads greater than -1.11 is 0.8665. That is, \(P(X>-1.11)=0.8665\)
Part 1.4 The probability that a randomly selected thermometer reads greater than -1.11 is \(0.8665 .\)
The probability that a randomly selected thermometer reads greater than –1.11 is obtained by substituting the mean as 0, standard deviation as 1, and score as –1.11 in Excel-MegaStat. There is an 86.65% of chance that a randomly selected thermometer reads greater than –1.11.
 Dr. OWL answered 5 years ago
Related Solutions
Assume that a randomly selected subject is given a bone density test. Those test scores are normally distributed with a...
Assume that a randomly selected subject is given a bone density test. Those test scores are...
Assume that a randomly selected subject is given a bone density test. Those test scores are...
assume that a randomly selected subject is given a bone density test. those test scores are...
Assume that a randomly selected subject is given a bone density test. Bone density test scores...
Standard Normal Distribution: Assume that a randomly selected subject is given a bone density test. Those...
For bone density scores that are normally distributed with a mean of 0 and a standard deviation of 1, find the percentage of scores that are
For bone density scores that are normally distributed with a mean of 0 and a standard...
For bone density scores that are normally distributed with a mean of 0 and a standard...
6.1 16. ASSUME THAT A RANDOMLY SELECTED SUBJECT IS GIVEN A BONE DENSITY TEST. THOSE TEST...
- in your own opinion, It has been said that a smartphone is a computer in your...
- Use the internet to read more about journaling file systems such as NTFS, extfs2, and extfs3....
- Consider the quick sort algorithm. The quick sort algorithm is a divide and conquer approach which...
- Tesla 1. How to make these weaknesses into strengths? Burn through cash, high prices, bottlenecking/product delays,...
- Assignment # 12: Email Presentation Learning Objectives and Outcomes Design a PowerPoint presentation appropriate for middle...
- Identify which of the perspectives you believe is the BEST for accurately explaining human behavior and...
- What trade policies should a country adopt? why? Explain. Also, find some reference materials on this...