Question
In: Statistics and Probability
Find the area of the shaded region. The graph depicts the standard normal distribution of bone density scores with mean 0 and standard deviation 1.
a) Find the area of the shaded region. The graph depicts the standard normal distribution of bone density scores with mean 0 and standard deviation 1.
b) Find the area of the shaded region. The graph depicts the standard normal distribution of bone density scores with mean 0 and standard deviation 1.
Solutions
Expert Solution
Concepts and reason
Normal distribution: Normal distribution is a continuous distribution of data that has a bell-shaped curve. The
normally distributed random variable \(x\) has mean \((\mu)_{\text {and standard deviation }}(\sigma)\) Also, the standard normal distribution represents a normal curve with mean 0 and standard deviation \(1 .\) Thus, the
parameters involved in a normal distribution are mean \((\mu)_{\text {and }}\) standard deviation \((\sigma)\) Standardized z-score: The standardized z-score represents the number of standard deviations the data point is away from the mean.
If the z-score takes a positive value when it is above the mean (0).
If the z-score takes a negative value when it is below the mean (0).
Sampling distribution of sample mean:
The sampling distribution of the sample means \((\bar{x})\) for the given sample size n consists of the collection of the means of all possible samples of size \(\mathrm{n}\) from the population.
Fundamentals
Let \(X \sim N(\mu, \sigma)\), and then the standard z-score is found using the formula given below:
\(z=\frac{X-\mu}{\sigma}\)
X denotes the individual raw score, \(\mu\) denotes the population means, and \(\sigma\) denotes the population standard deviation. Some of the formulas for finding probability are, \(P(a \leq Z \leq b)=P(Z \leq b)-P(Z \leq a)\)
The procedure for finding the z-value is listed below:
1.From the table of the standard normal distribution, locate the probability value.
2.Move left until the first column is reached.
3.Move upward until the top row is reached.
4.Locate the probability value, by the intersection of the row and column values, gives the area to the left of z.
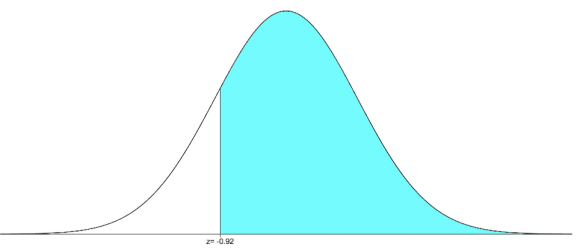
(a) The given plot depicts the standard normal distribution of bone density scores with mean 0 and standard deviation
\(1 .\)
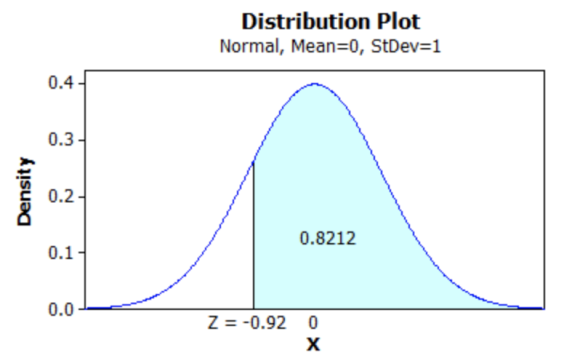
Compute \(P(Z \geq-0.92)\)
\(P(Z \geq-0.92)=1-P(Z \leq-0.92)\)
\(=1-0.1788 \quad\) (From normal area table values)
=0.8212
The above probability value can be shown in the plot as follows:
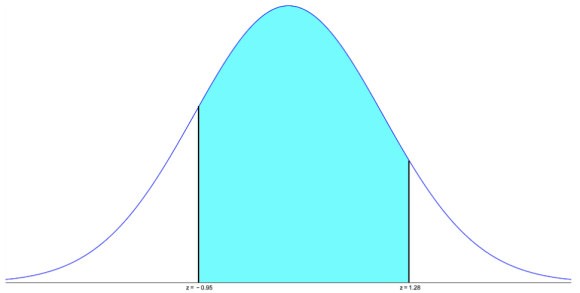
(b) The given plot depicts the standard normal distribution of bone density scores with mean 0 and standard deviation
1.
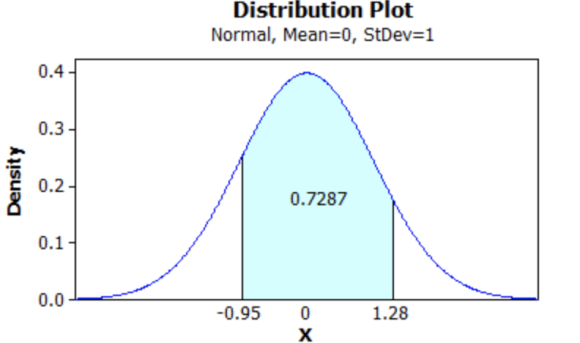
Compute \(P(-0.95 \leq Z \leq 1.28)\)
\(P(-0.95 \leq Z \leq 1.28)=P(Z \leq 1.28)-P(Z \leq-0.95)\)
=0.8997-0.1711
=0.7287
(From Normal area table values)
The above probability value can be shown in the plot as follows:
 Dr. OWL answered 5 years ago
Related Solutions
Find the area of the shaded region. The graph depicts the standard normal distribution of bone...
Find the area of the shaded region. The graph depicts the standard normal distribution of bone...
Find the area of the shaded region. The graph depicts the standard normal distribution of bone...
Find the area of the shaded region. The graph depicts the standard normal distribution of bone...
Find the area of the shaded region. The graph depicts the standard normal distribution of bone...
Find the area of the shaded region. The graph depicts the standard normal distribution of bone...
Find the area of the shaded region. The graph depicts the standard normal distribution of bone...
Find the area of the shaded region. The graph depicts the standard normal distribution of bone...
Find the area of the shaded region. The graph depicts the standard normal distribution with mean...
1) Find the area of the shaded region. The graph depicts the standard normal distribution with...
- 1. Why is leadership outlook on security critical to employee buy-in at all levels? Give examples to...
- Students performed a procedure similar to Part III of this experiment (Analyzing a Vitamin Supplement for...
- The output of the function is a dictionary whose keys represent the bins and whose values...
- The shape of a graph of a binomial distribution depends on the value of both n...
- In 2012, cost per Medicare beneficiary did what?
- 3. A. What techniques can a firm use to optimize demand deposit holdings? B. How do...
- The half-life of mercury-197 is 64.1 hours. If a patient undergoing a kidney scan is given...