Question
In: Statistics and Probability
1. The following data shows memory scores collected from adults of different ages. Age (X) Memory...
1. The following data shows memory scores collected from adults of different ages.
|
Age (X) |
Memory Score (Y) |
|
25 |
10 |
|
32 |
10 |
|
39 |
9 |
|
48 |
9 |
|
56 |
7 |
Use the data to find the regression equation for predicting memory scores from age
Group of answer choices
a. Ŷ = 4.33X + 0.11
b. Ŷ = -0.11X + 4.33
c. Ŷ = -0.11X + 13.26
d. Ŷ = -0.09X + 5.4
e. Ŷ = -0.09X + 12.6
1a
Use the regression equation you found in question 21 to find the predicted memory scores for the following age: 28
1b.
Use the regression equation you found in question 21 to find the predicted memory scores for the following age: 43
1c.
Use the regression equation you found in question 21 to find the predicted memory scores for the following age: 50
Solutions
Expert Solution
Solution:
From given data , we prepare a table.
| X | Y | XY | X^2 | Y^2 |
| 25 | 10 | 250 | 625 | 100 |
| 32 | 10 | 320 | 1024 | 100 |
| 39 | 9 | 351 | 1521 | 81 |
| 48 | 9 | 432 | 2304 | 81 |
| 56 | 7 | 392 | 3136 | 49 |
| n | 5 |
| sum(XY) | 1745.00 |
| sum(X) | 200.00 |
| sum(Y) | 45.00 |
| sum(X^2) | 8610.00 |
| sum(Y^2) | 411.00 |
| Numerator | -275.00 |
| Denominator | 302.49 |
| r | -0.9091 |
| r square | 0.8265 |
| Xbar(mean) | 40.0000 |
| Ybar(mean) | 9.0000 |
| SD(X) | 11.0454 |
| SD(Y) | 1.0954 |
| b | -0.0902 |
| a | 12.6066 |
Now ,
Slope of the regression line is
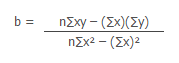
b = -0.09
Now , y intercept of the line is
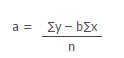
a = 12.6
The equation of the regression line is
= bx + a
= -0.09x + 12.6
Answer : option e
= -0.09x + 12.6
1a) For x = 28 , find the predicted value of y .
Put x = 28 in the regression line equation.
= bx + a
= (-0.09*28) + 12.6
Answer:
= 10.08
1b) For x = 43 , find the predicted value of y .
Put x = 43 in the regression line equation.
= bx + a
= (-0.09*43) + 12.6
Answer:
= 8.73
1c) For x = 50 , find the predicted value of y .
Put x = 50 in the regression line equation.
= bx + a
= (-0.09*50) + 12.6
Answer:
= 8.10
 orchestra answered 3 years ago
Related Solutions
The following data shows the age at diagnosis of type ii diabetes in young adults. Is...
1) The following data shows the yearly production data collected from firms in XYZ state and...
Does a person’s cholesterol level increase with age? Data collected from 1406 adults aged 45 to...
The following data shows the yearly production data collected from country A and B. Yearly profit...
Exercise 1 Create a data file in SPSS using the following memory scores for this sample...
A survey was conducted among 20 adults. The following shows the age of the respondents. 44...
The following table gives the data from a local school district on children's ages (x) and...
The following data was collected from a TLC plate for 4 different compounds. The distance's traveled...
The following data set shows the ages of the Best Actress and Best Actor award at...
The following data set shows the ages of the Best Actress and Best Actor award at...
- Consider two markets: the market for cat food and the market for dog food. The initial...
- Why is business ethics unavoidable?
- mr. smith completed 9 years of fixed monthly payments of 3,333.28 on a 30 year loan...
- during the experiment, a student did not follow the procedure exactly as directed how will eact...
- Assume all temperatures to be exact, and neglect significant figures for small changes in dimension. When...
- why is Argentina a developing country ?
- Calculate the enthalpy of the reaction 4B(s)+3O2(g)?2B2O3(s) given the following pertinent information: B2O3(s)+3H2O(g)?3O2(g)+B2H6(g), ?H?A=+2035 kJ 2B(s)+3H2(g)?B2H6(g),