Question
In: Accounting
1. Why are product cost variances (DM, DL, MOH) broken down and separated into price &...
1. Why are product cost variances (DM, DL, MOH) broken down and separated into price & quantity variance or rate & efficiency variance. What is the purpose and what information do these additional variances provide?
2.How do you balance a company's need to succeed and make money, as well as the need to not ask workers for perfection? Is there a middle ground, what do you think?
Solutions
Expert Solution
Answr: Question 1:
Variance Analyssis
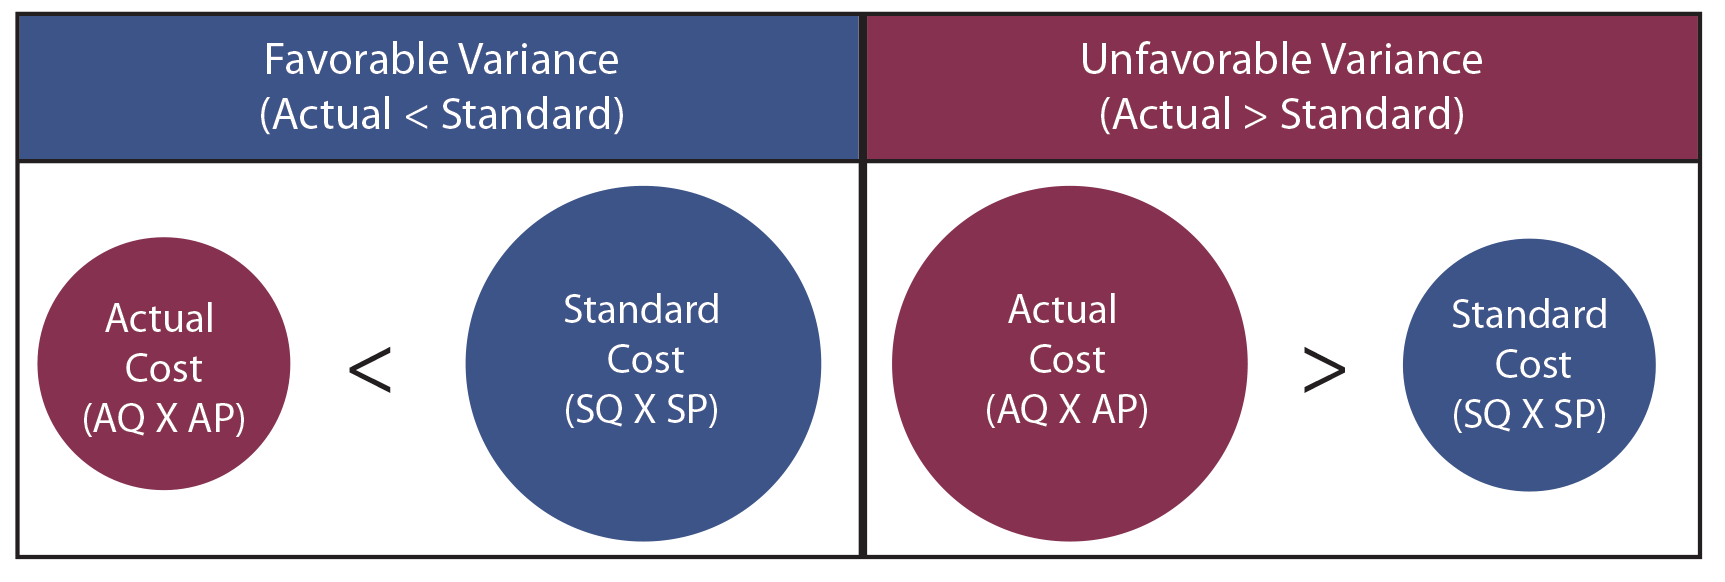
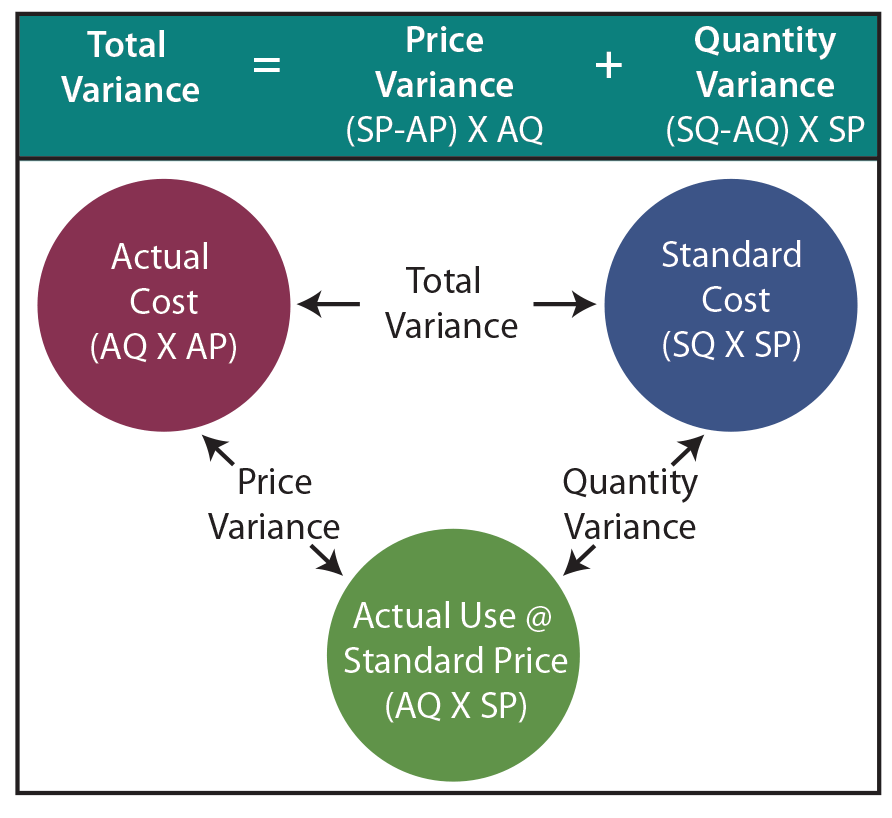
Standard costs provide information that is useful in performance evaluation. Standard costs are compared to actual costs, and mathematical deviations between the two are termed variances. Favorable variances result when actual costs are less than standard costs, and vice versa. The following illustration is intended to demonstrate the very basic relationship between actual cost and standard cost. AQ means the “actual quantity” of input used to produce the output. AP means the “actual price” of the input used to produce the output. SQ and SP refer to the “standard” quantity and price that was anticipated. Variance analysis can be conducted for material, labor, and overhead.

Direct Material Variances
 Management
is responsible for evaluation of variances. This task is an
important part of effective control of an organization. When total
actual costs differ from total standard costs, management must
perform a more penetrating analysis to determine the root cause of
the variances. The total variance for direct materials is found by
comparing actual direct material cost to standard direct material
cost. However, the overall materials variance could result from any
combination of having procured goods at prices equal to, above, or
below standard cost, and using more or less direct materials than
anticipated. Proper variance analysis requires that the Total
Direct Materials Variance be separated into the:
- Materials Price Variance: A variance that reveals the difference between the standard price for materials purchased and the amount actually paid for those materials [(standard price – actual price) X actual quantity].
- Materials Quantity Variance: A variance that compares the standard quantity of materials that should have been used to the actual quantity of materials used. The quantity variation is measured at the standard price per unit [(standard quantity – actual quantity) X standard price].
Journal Entries
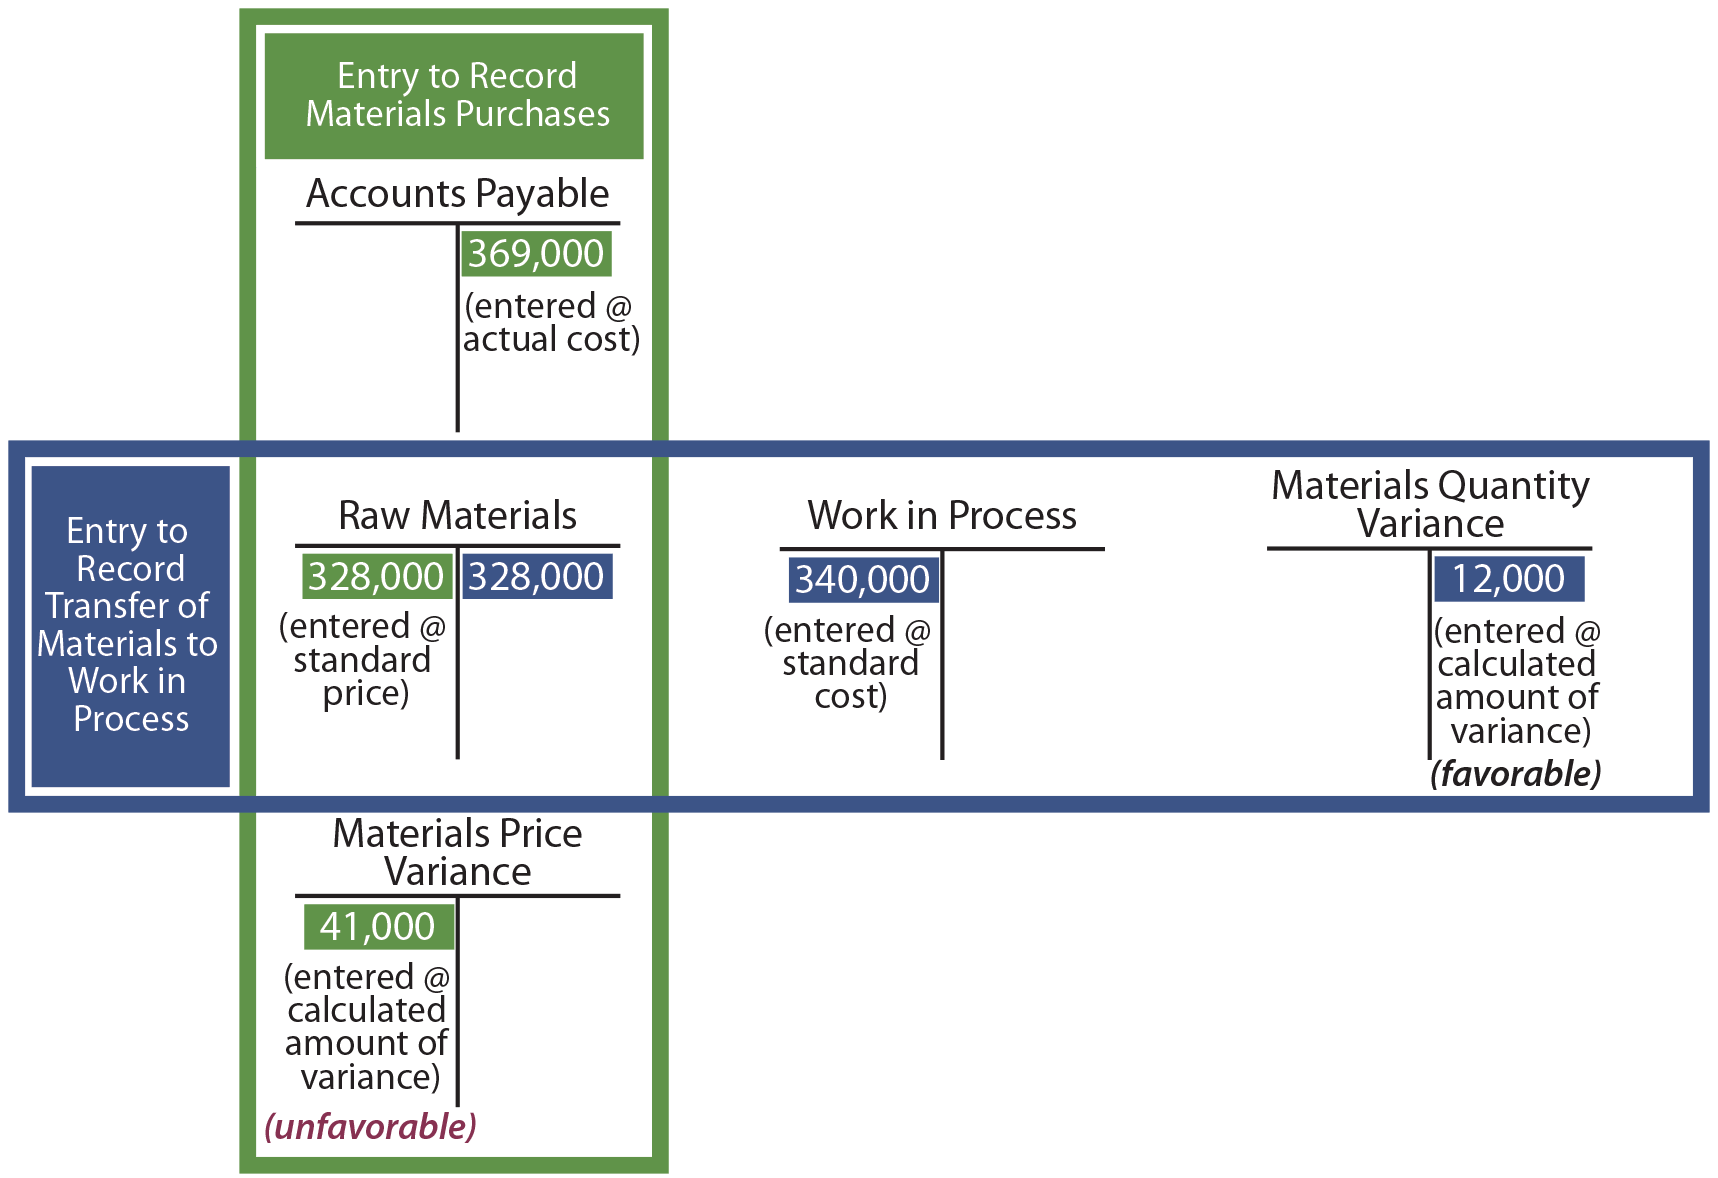
Work in Process is debited for the standard cost of the standard quantity that should be used for the productive output achieved, no matter how much is used. Any difference between standard and actual raw material usage is debited (unfavorable) or credited (favorable) to the Materials Quantity Variance account:

The price and quantity variances are generally reported by decreasing income (if unfavorable debits) or increasing income (if favorable credits), although other outcomes are possible. Examine the following diagram and notice the $369,000 of cost is ultimately attributed to work in process ($340,000 debit), materials price variance ($41,000 debit), and materials quantity variance ($12,000 credit). This illustration presumes that all raw materials purchased are put into production. If this were not the case, then the price variances would be based on the amount purchased while the quantity variances would be based on output.

Direct Labour Variances
 The
logic for direct labor variances is very similar to that of direct
material. The total variance for direct labor is found by comparing
actual direct labor cost to standard direct labor cost. If actual
cost exceeds standard cost, the resulting variances are unfavorable
and vice versa. The overall labor variance could result from any
combination of having paid laborers at rates equal to, above, or
below standard rates, and using more or less direct labor hours
than anticipated.
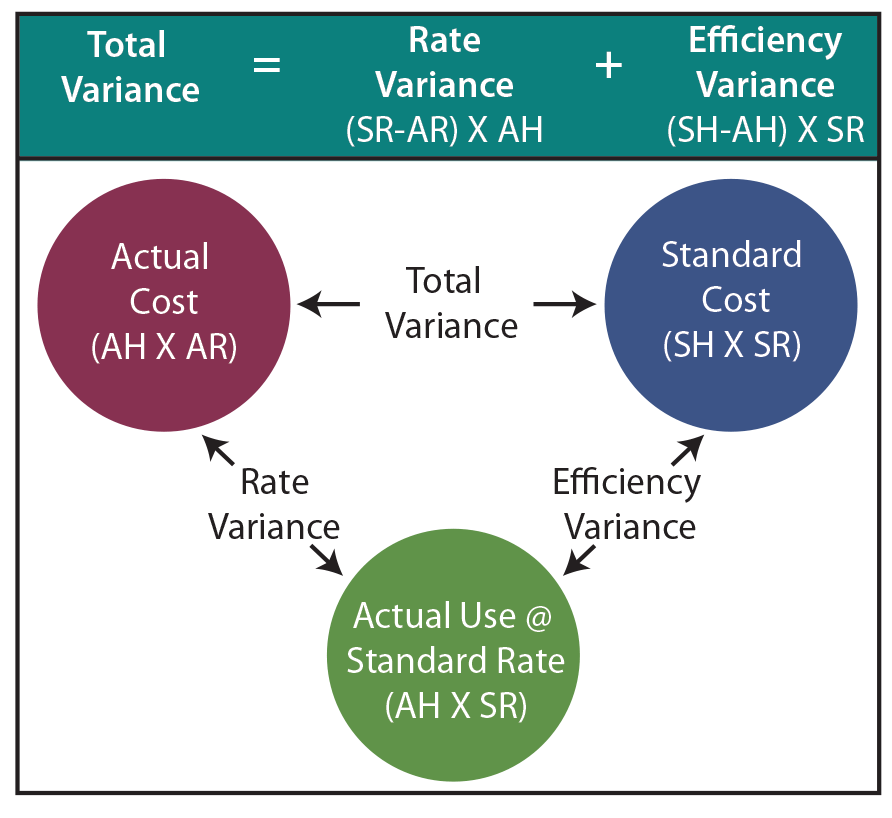
In this illustration, AH is the actual hours worked, AR is the actual labor rate per hour, SR is the standard labor rate per hour, and SH is the standard hours for the output achieved.
The Total Direct Labor Variance consists of:
- Labor Rate Variance: A variance that reveals the difference between the standard rate and actual rate for the actual labor hours worked [(standard rate – actual rate) X actual hours].
- Labor Efficiency Variance: A variance that compares the standard hours of direct labor that should have been used to the actual hours worked. The efficiency variance is measured at the standard rate per hour [(standard hours – actual hours) X standard rate].
As with material variances, there are several ways to perform the intrinsic labor variance calculations. One can compute the values for the red, blue, and green balls. Or, one can perform the noted algebraic calculations for the rate and efficiency variances.
Journal Entry
If Blue Rail desires to capture labor variances in its general ledger accounting system, the entry might look something like this:

Once again, debits reflect unfavorable variances, and vice versa. Such variance amounts are generally reported as decreases (unfavorable) or increases (favorable) in income, with the standard cost going to the Work in Progress.
MOH Variance
The variable overhead efficiency variance is the difference between the actual activity level in the allocation base (often direct labor hours or machine hours) and the budgeted activity level in the allocation base according to the standards.
The two variances used to analyze this difference are the spending variance and efficiency variance. The variable overhead spending variance is the difference between actual costs for variable overhead and budgeted costs based on the standards. For a company that allocates variable manufacturing overhead to products based on direct labor hours, the variable overhead efficiency variance is the difference between the number of direct labor hours actually worked and what should have been worked based on the standards.
At Jerry’s Ice Cream, the actual data for the year are as follows:
| Sales volume | 210,000 units |
| Direct labor hours worked | 18,900 hours |
| Total cost of variable overhead | $100,000 |
Recall from Figure 10.1 "Standard Costs at Jerry’s Ice Cream" that the variable overhead standard rate for Jerry’s is $5 per direct labor hour and the standard direct labor hours is 0.10 per unit. Figure 10.8 "Variable Manufacturing Overhead Variance Analysis for Jerry’s Ice Cream" shows how to calculate the variable overhead spending and efficiency variances given the actual results and standards information. Review this figure carefully before moving on to the next section where these calculations are explained in detail.
Figure 10.8 Variable Manufacturing Overhead Variance Analysis for Jerry’s Ice Cream

Companies use variance analysis in different ways. The starting point is the determination of standards against which to compare actual results. Many companies produce variance reports, and the management responsible for the variances must explain any variances outside of a certain range. Some companies only require that unfavorable variances be explained, while many companies require both favorable and unfavorable variances to be explained.
Requiring managers to determine what caused unfavorable variances forces them to identify potential problem areas or consider if the variance was a one-time occurrence. Requiring managers to explain favorable variances allows them to assess whether the favorable variance is sustainable. Knowing what caused the favorable variance allows management to plan for it in the future, depending on whether it was a one-time variance or it will be ongoing.
Another possibility is that management may have built the favorable variance into the standards. Management may overestimate the material price, labor rate, material quantity, or labor hours per unit, for example. This method of overestimation, sometimes called budget slack, is built into the standards so management can still look good even if costs are higher than planned. In either case, managers potentially can help other managers and the company overall by noticing particular problem areas or by sharing knowledge that can improve variances.
Often, management will manage “to the variances,” meaning they will make decisions that may not be advantageous to the company’s best interests over the long run, in order to meet the variance report threshold limits. This can occur when the standards are improperly established, causing significant differences between actual and standard numbers.
Ethical Long-Term Decisions in Variance Analysis
The proper use of variance analysis is a significant tool for an organization to reach its long-term goals. When its accounting system recognizes a variance, an organization needs to understand the significant influence of accounting not only in recording its financial results, but also in how reacting to that variance can shape management’s behavior toward reaching its goals.1 Many managers use variance analysis only to determine a short-term reaction, and do not analyze why the variance occurred from a long-term perspective. A more long-term analysis of variances allows an approach that “is responsibility accounting in which authority and accountability for tasks is delegated downward to those managers with the most influence and control over them.”2 It is important for managers to analyze the reported variances with more than just a short-term perspective.
Variance analysis, also described as analysis of variance or ANOVA, involves assessing the difference between two figures. It is a tool applied to financial and operational data that aims to identify and determine the cause of the variance. In applied statistics, there are different forms of variance analysis. In project management, variance analysis helps maintain control over a project's expenses by monitoring planned versus actual costs. Effective variance analysis can help a company spot trends, issues, opportunities and threats to short-term or long-term success
Budget vs. Actual Costs
Variance analysis is important to assist with managing budgets by controlling budgeted versus actual costs. In program and project management, for example, financial data are generally assessed at key intervals or milestones. For instance, a monthly closing report might provide quantitative data about expenses, revenue and remaining inventory levels. Variances between planned and actual costs might lead to adjusting business goals, objectives or strategies.
The Materiality Threshold
A materiality threshold is the level of statistical variance deemed meaningful, or worth noting. This will vary from company to company. For example, a sales target variance of $100,000 will be more material to a small business retailer than to a national retailer accustomed to generating billions in annual revenues. Conversely, a 2 percent cost overrun might be immaterial for a small business but translate into millions of dollars for a large company.
Relationships Between Variables
Relationships between pairs of variables might also be identified when performing variance analysis. Positive and negative correlations are important in business planning.
As an example, variance analysis might reveal that when sales for widget A rise there is a correlated rise in the sales for widget B. Improved safety features for one product might result in sales increases. This information might be used to transfer this success to other similar products.
Business Trend Forecasting
An important type of prediction is business forecasting. It uses patterns of past business data to construct a theory about future performance. Variance data are placed into context that allows an analyst to identify factors such as holidays or seasonal changes as the root cause of positive or negative variances.
For example, the monthly pattern of sales of television sets over five years might identify a positive sales trend leading up to the beginning of the school year. As a result, forecasts for television sales over the next 12 months might include increasing inventory by a certain percentage – based on historical sales patterns – in the weeks before the start of local universities' fall term.
Related Solutions
Why are product cost variances (DM, DL, MOH) broken down and separated into price & quantity...
direct material (DM), direct labor (DL) and manufacturing overhead (MOH) are considered components of product cost...
1. DL and VarMOH variances (5pts): Handerson Corporation makes a product with the following standard costs:...
Cantor Products sells a product for $75. DM costs per unit and DL costs per unit...
In calculating budget variances the total variance was broken down into various components, when added up...
3. DL and VarMOH variances: HoldOn Corporation makes a product with the following standard costs: Standard...
How are price and quantity variances computed? Why are separate price and quantity variances useful to...
1) TAGs are broken down into glycerol and fatty acids, what happens to them?
Regulating Metabolism 1. Fatty acids are broken down into ____________________, which occurs in the ____________________________. 2....
Why does the mitochondria produce more ATP than glycolysis for each molecule of glucose broken down?...
- Kp has the value 1.00x10^-5 for the equilibrium CO2(g) + H2(g) <--> CO(g) + H2O(g) at...
- Write a MARIE program that asks the user for a beginning and an ending address of...
- Calculate the energy gap in J, kJ/mol, eV, and wavenumber (cm-1) between the level n =...
- 2. a. Choose all of the following that apply to DynamoDB: (a) DynamoDB is part of...
- I asked this question before, but I'm wondering if there are any other ways to do...
- Can you please Describe your actions as the Manager, and how you would manage the project...
- Suppose we have a collection of n different subsets of the set { 1, 2, ...,...
 ekkarill92 answered 3 years ago