Question
In: Computer Science
Using the descriptions given in the figure, convert the ERD shown in Figure P6.2 into a...
Using the descriptions given in the figure, convert the ERD shown in Figure P6.2 into a dependancy diagram that is in at least 3NF.
Solutions
Expert Solution
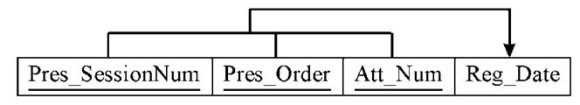
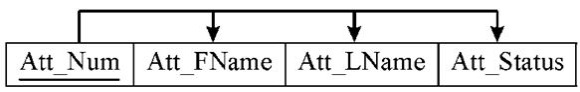
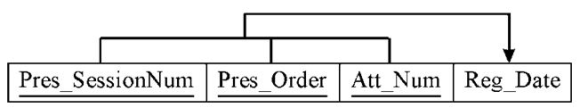
Dependency diagram for given ERD:
PRESENTATION: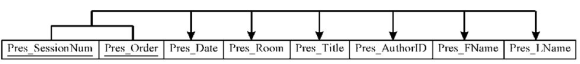
REGISTRATION:
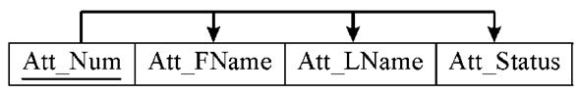
ATTENDEE:
Here,
REGISTRATION and ATTENDEE are 3NF
PRESENTATION is not 3NF
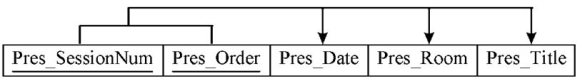
So, remove the attributes which are depending on a non-key attribute from the given relation to convert the PRESENTATION into 3NF.
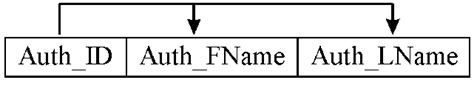
Hence, the database can be divided into four relations as below.
PRESENTATION:
REGISTRATION:
ATTENDEE:
AUTHOR:
 venereology answered 4 years ago
Related Solutions
Using my chosen figure Sargon. Introduce your chosen figure, and provide descriptions of the following elements:...
Using my chosen figure Sargon. Introduce your chosen
figure, and provide descriptions of the following elements: the
leader, when he or she lived, and the area over which he or she
presided. Include notable actions and accomplishments associated
with his or her period of leadership. Identify the lasting
significance of this ruler on the modern world. Your response must
be a minimum of 300 words in length.
Match the descriptions below with the correct answer, using the letter codes shown in the table...
Match the descriptions below with the correct answer,
using the letter codes shown in the table below. (8 points)
A. Realizable value
B. Percentage of receivables method
C. 1/10, n/60
D. Bad debt Expense
E. Aging of receivables
F. Direct write-off
method
G. Operating cycle
H. Specific identification method
I. FOB shipping
point
J. Time period
assumption
K. n/10 EOM
L. Percentage of sales method
M. Permanent accounts
N. 2/10, EOM
O. 2/10, n/30
P. FOB destination
The economic life...
Given the following business scenario, create a Crow’s Foot ERD using a specialization hierarchy if appropriate....
Given the following business scenario, create a Crow’s Foot ERD
using a specialization hierarchy if appropriate.
Two-Bit Drilling Company keeps information on employees and
their insurance dependents. Each employee has an employee number,
name, date of hire, and title. If an employee is an inspector, then
the date of certification and the renewal date for that
certification should also be recorded in the system. For all
employees, the Social Security number and dependent names should be
kept. All dependents must...
Given the following business scenario, create a Crow’s Foot ERD using a specialization hierarchy (EER) if...
Given the following business scenario, create a Crow’s Foot ERD
using a specialization hierarchy (EER) if appropriate.
Two-Bit Drilling Company keeps information on employees and
their insurance dependents. Each employee has an employee number,
name, date of hire, and title. If an employee is a full-time
inspector, then the date of certification, the renewal date for
that certification, and the yearly salary should also be recorded
in the system. If an employee is a part-time inspector, then the
date of...
Given the two charged particles shown in the figure below, find the electric field at the...
Given the two charged particles shown in the figure below, find
the electric field at the origin. (Let
q1 = −26.00 nC and
q2 = 7.00 nC. Express your
answer in vector form.) q1 is at (2,4) and q2 is at (-2,3)
Given the information below, create the fully labeled Crow's Foot ERD using a specialization hierarchy where...
Given the information below, create the fully labeled Crow's
Foot ERD using a specialization hierarchy where appropriate (use
Visio). The ERD must contain all primary keys, foreign keys, and
main attributes. Business rules are defined as follows:
At a hospital, each patient is classified as either a resident
patient or an outpatient. All patients have common attributes - ID,
first and last name, and diagnosis - and unique attributes that are
specific to their groups. The list of such attributes...
Given the information below, create the fully labeled Crow's Foot ERD using a specialization hierarchy where...
Given the information below, create the fully labeled Crow's
Foot ERD using a specialization hierarchy where appropriate (use
Visio). The ERD must contain all primary keys, foreign keys, and
main attributes. Business rules are defined as follows: A small
company sells products on-line. Each product is supplied by one
supplier. Each supplier delivers only one product. Each product
belongs to one of the following categories: Books, Movies, or CDs.
All products have common attributes - a product code, a title...
Consider the reversible Carnot cycle shown in the following figure given below with 1.19 mol of...
Consider the reversible Carnot cycle shown in the following
figure given below with 1.19 mol of an ideal gas with C V,m =5R/2
as the working substance. The initial isothermal expansion occurs
at the hot reservoir temperature of T hot = 890 K from an initial
volume of 3.85 L ( V a ) to a volume of 10.5 L ( V b ) . The system
then undergoes an adiabatic expansion until the temperature falls
to T cold =...
What is the equivalent resistance for the circuit shown in the figure? (Figure 1) For the...
What is the equivalent resistance for the circuit shown in the
figure? (Figure 1)
For the circuit shown in the figure, find the current through
resistor R1=6.0?(left). (Figure 1)
For the circuit shown in the figure, find the potential
difference across resistor R1=6.0?(left).
For the circuit shown in the figure, find the current through
resistor R2=15?.
For the circuit shown in the figure, find the potential
difference across resistor R2=15?.
For the circuit shown in the figure, find the current...
A piece of insulated wire is shaped into a figure eight as shown in the figure...
A piece of insulated wire is shaped into a figure eight as shown
in the figure below. For simplicity, model the two halves of the
figure eight as circles. The radius of the upper circle is 4.00 cm
and that of the lower circle is 8.00 cm. The wire has a uniform
resistance per unit length of 7.00 Ω/m. A uniform magnetic field is
applied perpendicular to the plane of the two circles, in the
direction shown. The magnetic field...
ADVERTISEMENT
ADVERTISEMENT
Latest Questions
- An Auditor may decide to make use of a specialist in obtaining sufficient appropriate audit evidence...
- Dirac's Theorem states that "A simple graph with n vertices (n >= 3) is Hamiltonian if...
- Two 10-cm-diameter charged rings face each other, 15cm apart. The left ring is charged to -29nC...
- Under what conditions would it be possible for an excise tax to have no efficiency cost...
- explain the difference between activities and financial statements of service businesses and merchandising businesses.
- 2. Compare and compare the matrix multiplication algorithm and the Floyd-Warshall algorithm to find all pairs...
- Q: 50.00 ml of 0.5216 M copper(II) nitrate solution is combined with 100.0 ml of 0.5580...
ADVERTISEMENT