Question
In: Math
One of the consequences of the economic meltdown in Great Recession has been a free fall...
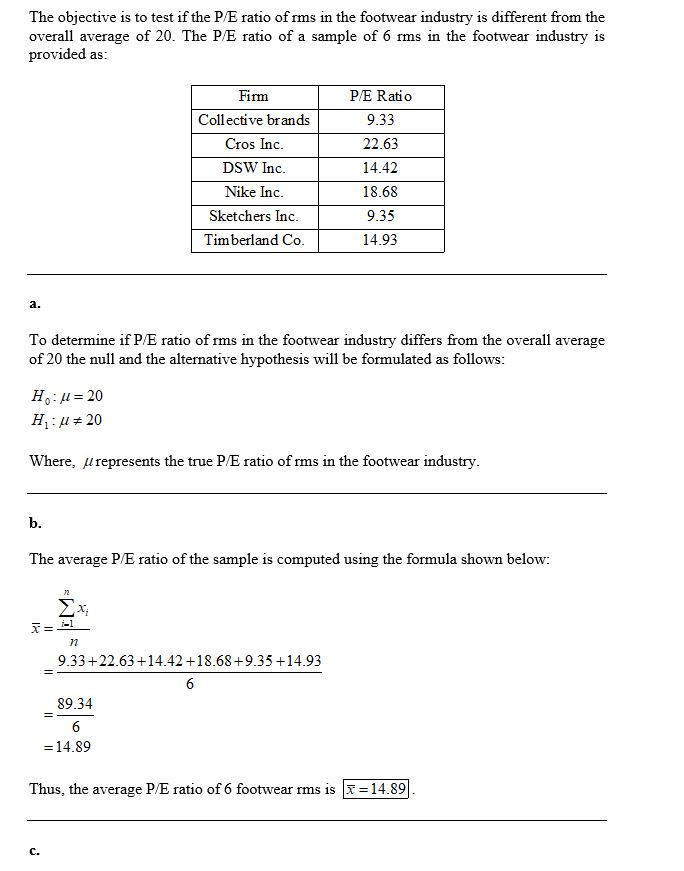
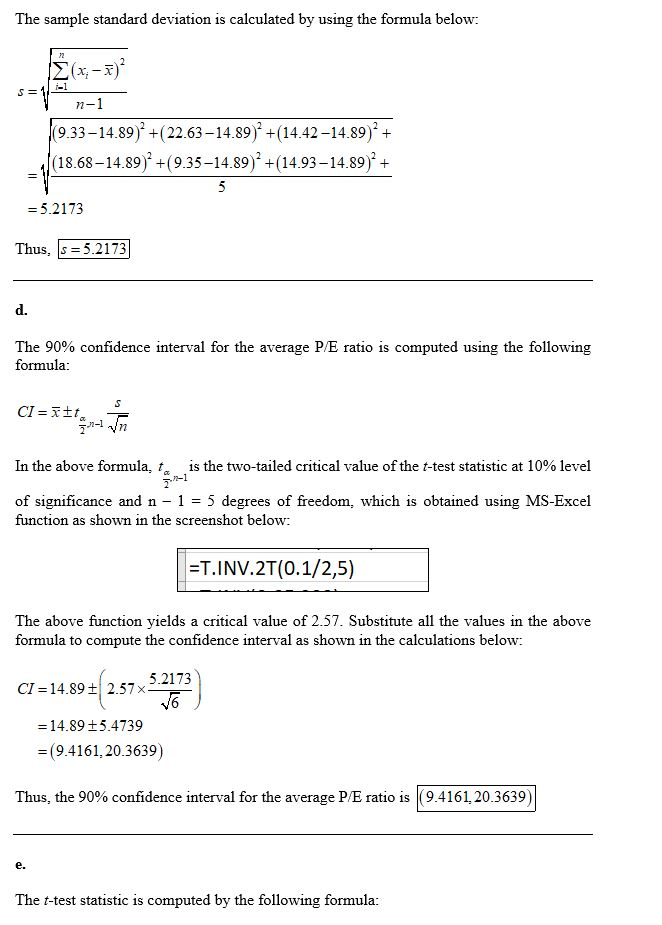
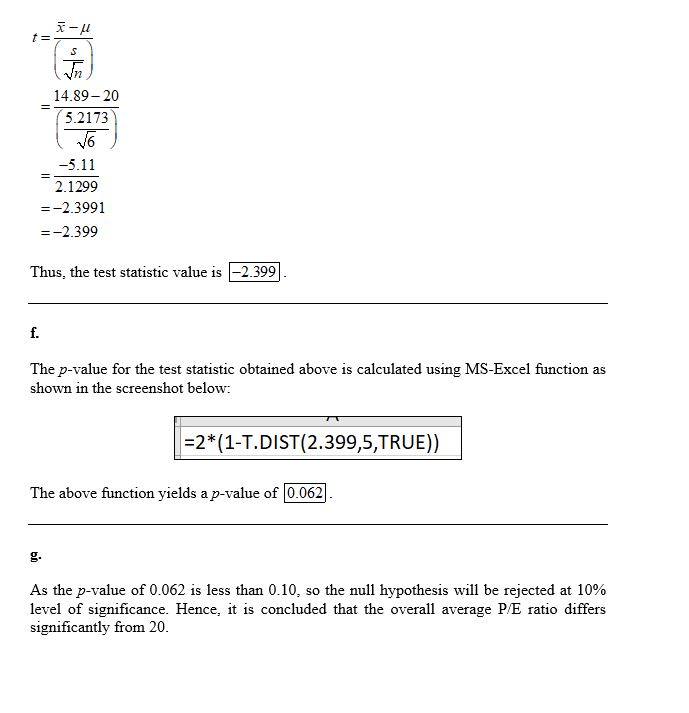
One of the consequences of the economic meltdown in Great Recession has been a free fall of the stock market's average price/earning ratio, or P/E ratio. Generally, a high P/E ratio suggest that investors are expecting higher earnings growth in the future compared to companies with a lower P/E ratio. A Wall Street analyst wants to determine if the P/E ratio of rms in the footwear industry is dierent from the overall average of 20. The table below shows that P/E ratio for a sample of six rms in the footwear industry: Firm P/E ratio Collective Brands, Inc. 9.33 Cros,Inc. 22.63 DSW, Inc. 14.42 Nike, Inc. 18.68 Sketchers USA, Inc 9.35 Timberland Co. 14.93 a. (3 points) Let µ be the overall average P/E ratio. State the null and the alternative hypothesis in order to test whether the P/E ratio of rms in the footwear industry diers from the overall average of 20. b. (3 points) What is the average P/E ratio among the six footwear rms, i.e., x¯ =? c. (3 points) What is the standard deviation of the P/E ratio among the six footwear rms, i.e., s =? (Please around your answer to 4 decimal places. d. (3 points) Construct a 90% condence interval of the overall average P/E ratio, i.e., 90% condence interval of µ. (Please around your answer to 4 decimal places.) e. (2 point) Calculate the value of test statistic. (Please around your answer to 3 decimal places.) f. (4 points) Approximate the p-value in this test? g. (3 points) Does the P/E ratio of rms in the footwear industry dier from the overall average of 20? Please explain.
Solutions
 milcah answered 1 hour ago
Related Solutions
The Great Recession was the most serious economic downturn in U.S. history since the Great Depression....
The Great Recession was the most serious economic downturn in U.S. history since the Great Depression....
The Great Recession was the most serious economic downturn in U.S. history since the Great Depression....
which of the following is an impact of the Great Recession on retailing trends? a. economic...
Evaluate and analyze the consequences of the solutions for an economic recession for jobless individuals around...
Evaluate and analyze the consequences of the solutions for an economic recession for jobless individuals around...
Evaluate and analyze the consequences of the solutions for an economic recession for jobless individuals around...
Evaluate and analyze the consequences of the solutions for an economic recession for jobless individuals around...
Evaluate and analyze the consequences of the solutions for an economic recession for jobless individuals around...
Evaluate and analyze the consequences of the solutions for an economic recession for jobless individuals around...
- One of the consequences of the economic meltdown in Great Recession has been a free fall...
- Please code the following prompt in python. Today you will be building a movie/actor lookup. The...
- In the context of software reliability and statistical testing: (a) Define operation profile and (b) Where...
- How to add and multiply two matrices in the following code? #include "My_matrix.h" #include <stdexcept> My_matrix::My_matrix()...
- Argentina Partners is concerned about the possible effects of inflation on its operations. Presently, the company...
- what is your take on positive psychology? Post your thoughts with reference.
- Draw diagram building structure wuth 4 floors for hcc, vcc, mdf, and idf