Question
In: Math
4. Consider the following data drawn independently from normally distributed populations: (You may find it useful...
4. Consider the following data drawn independently from normally distributed populations: (You may find it useful to reference the appropriate table: z table or t table)
| x−1 = −1.6 | x−2 = −16.3 |
| s12 = 8.9 | s22 = 7.9 |
| n1 = 23 | n2 = 15 |
a. Construct the 95% confidence interval for the
difference between the population means. Assume the population
variances are unknown but equal. (Round all intermediate
calculations to at least 4 decimal places and final answers to 2
decimal places.)
Confidence interval is to .
b. Specify the competing hypotheses in order to
determine whether or not the population means differ.
-
H0: μ1 − μ2 = 0; HA: μ1 − μ2 ≠ 0
-
H0: μ1 − μ2 ≥ 0; HA: μ1 − μ2 < 0
-
H0: μ1 − μ2 ≤ 0; HA: μ1 − μ2 > 0
c. Using the confidence interval from part a, can you reject the null hypothesis?
-
Yes, since the confidence interval includes the hypothesized value of 0.
-
No, since the confidence interval includes the hypothesized value of 0.
-
Yes, since the confidence interval does not include the hypothesized value of 0.
-
No, since the confidence interval does not include the hypothesized value of 0.
d. Interpret the results at αα = 0.05.
-
We conclude that population mean 1 is greater than population mean 2.
-
We cannot conclude that population mean 1 is greater than population mean 2.
-
We conclude that the population means differ.
-
We cannot conclude that the population means differ.
Solutions
Expert Solution
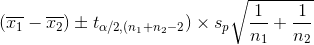
a.
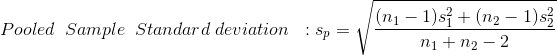
Formula for Confidence Interval for Difference in two Population means when population Standard deviation are not known but equal
 for 95% confidence level = (100-95)/100 =0.05
/2
= 0.05/2 =0.025
Degrees of freedom: df =n1+n2-2 = 23+15-2 =36

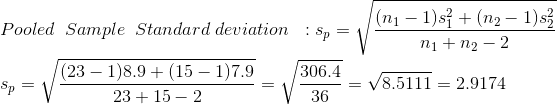
95% confidence interval for the difference between the population means.
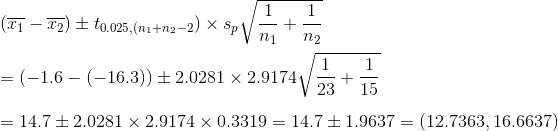
Confidence interval is 12.7363 to 16.6637
b. Specify the competing hypotheses in order to determine whether or not the population means differ.
H0:  ; HA:
; HA: 
c.
c. Using the confidence interval from part a, can you reject the null hypothesis?
-
Yes, since the confidence interval includes the hypothesized value of 0.
d. Interpret the results at αα = 0.05.
-
We conclude that the population means differ.
 milcah answered 2 months ago
Related Solutions
Consider the following data drawn independently from normally distributed populations: (You may find it useful to...
Consider the following data drawn independently from normally distributed populations: (You may find it useful to...
Consider the following data drawn independently from normally distributed populations: (You may find it useful to...
Consider the following data drawn independently from normally distributed populations: (You may find it useful to...
Consider the following data drawn independently from normally distributed populations: (You may find it useful to...
Consider the following data drawn independently from normally distributed populations: (You may find it useful to...
Consider the following data drawn independently from normally distributed populations: (You may find it useful to...
Consider the following data drawn independently from normally distributed populations: (You may find it useful to...
Consider the following data drawn independently from normally distributed populations: (You may find it useful to...
Consider the following data drawn independently from normally distributed populations: (You may find it useful to...
- Assignment 4, Fraction Comparable Instructions For this assignment, you will be updating the Fraction class from...
- what crystal claim that English is doing across the world?
- Site map for your e-commerce site. How many webpages this site has? What’s the name of...
- A skier of mass 60 kg starts at the top of a steep slope with an...
- If banks must hold $4 in reserves for each $10 in deposits, and the public decides...
- A 244 g mass is hung on a spring. As a result the spring stretches 20.5...
- I'm trying to Generate number every 3 seconds and update the currenet number.I'm able to generate...