Question
In: Accounting
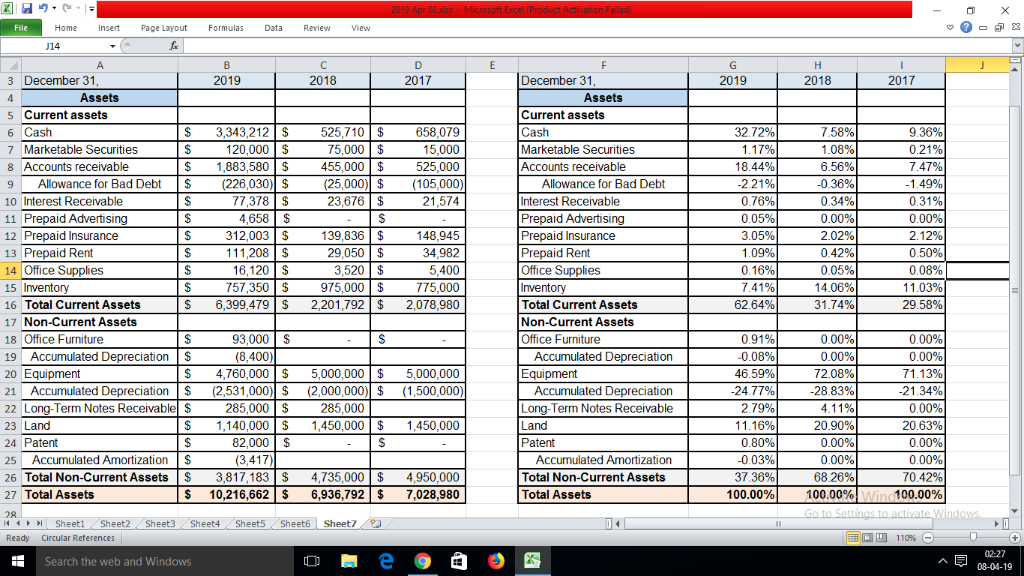
COMPARATIVE BALANCE SHEET December 31, 2019 218 2017 Assets Current assets Cash $ 3,343,212 $525,710 $658,079...
| COMPARATIVE BALANCE SHEET | |||
| December 31, | 2019 | 218 | 2017 |
| Assets | |||
| Current assets | |||
| Cash | $ 3,343,212 | $525,710 | $658,079 |
| Marketable Securities | 120,000 | 75,000 | 15,000 |
| Accounts receivable | 1,883,580 | 455,000 | 525,000 |
| Allowance for Bad Debt | (226,030) | (25,000) | (105,000) |
| Interest Receivable | 77,378 | 23,676 | 21,574 |
| Prepaid Advertising | 4,658 | - | - |
| Prepaid Insurance | 312,003 | 139,836 | 148,945 |
| Prepaid Rent | 111,208 | 29,050 | 34,982 |
| Office Supplies | 16,120 | 3,520 | 5,400 |
| Inventory | 757,350 | 975,000 | 775,000 |
| Total Current Assets | 6,399,479 | $2,201,792 | $2,078,980 |
| Non-Current Assets | |||
| Office Furniture | 93,000 | - | - |
| Accumulated Depreciation | (8,400) | ||
| Equipment | 4,760,000 | 5,000,000 | 5,000,000 |
| Accumulated Depreciation | (2,531,000) | (2,000,000) | (1,500,000) |
| Long-Term Notes Receivable | 285,000 | 285,000 | - |
| Land | 1,140,000 | 1,450,000 | 1,450,000 |
| Patent | 82,000 | - | - |
| Accumulated Amortization | (3,417) | ||
| Total Non-Current Assets | 3,817,183 | 4,735,000 | 4,950,000 |
| Total Assets | $ 10,216,662 | $ 6,936,792 | $ 7,028,980 |
Will you show me a vertical analysis of the assets portion of this balance sheet?
Solutions
Expert Solution
| Divider for all is Total Assets of particaluar year | |
| For Cash of 2019 (3343212/10216662) | 32.72% |
| For Cash of 2018 (525710/6936792) | 7.58% |
| For Cash of 2017 (658079/7028980) | 9.36% |
| Same do for all | |
|
COMPARATIVE BALANCE SHEET |
|||
| December 31, | 2019 | 2018 | 2017 |
| Assets | |||
| Current assets | |||
| Cash | 32.72% | 7.58% | 9.36% |
| Marketable Securities | 1.17% | 1.08% | 0.21% |
| Accounts receivable | 18.44% | 6.56% | 7.47% |
| Allowance for Bad Debt | -2.21% | -0.36% | -1.49% |
| Interest Receivable | 0.76% | 0.34% | 0.31% |
| Prepaid Advertising | 0.05% | 0.00% | 0.00% |
| Prepaid Insurance | 3.05% | 2.02% | 2.12% |
| Prepaid Rent | 1.09% | 0.42% | 0.50% |
| Office Supplies | 0.16% | 0.05% | 0.08% |
| Inventory | 7.41% | 14.06% | 11.03% |
| Total Current Assets | 62.64% | 31.74% | 29.58% |
| Non-Current Assets | |||
| Office Furniture | 0.91% | 0.00% | 0.00% |
| Accumulated Depreciation | -0.08% | 0.00% | 0.00% |
| Equipment | 46.59% | 72.08% | 71.13% |
| Accumulated Depreciation | -24.77% | -28.83% | -21.34% |
| Long-Term Notes Receivable | 2.79% | 4.11% | 0.00% |
| Land | 11.16% | 20.90% | 20.63% |
| Patent | 0.80% | 0.00% | 0.00% |
| Accumulated Amortization | -0.03% | 0.00% | 0.00% |
| Total Non-Current Assets | 37.36% | 68.26% | 70.42% |
| Total Assets | 100.00% | 100.00% | 100.00% |
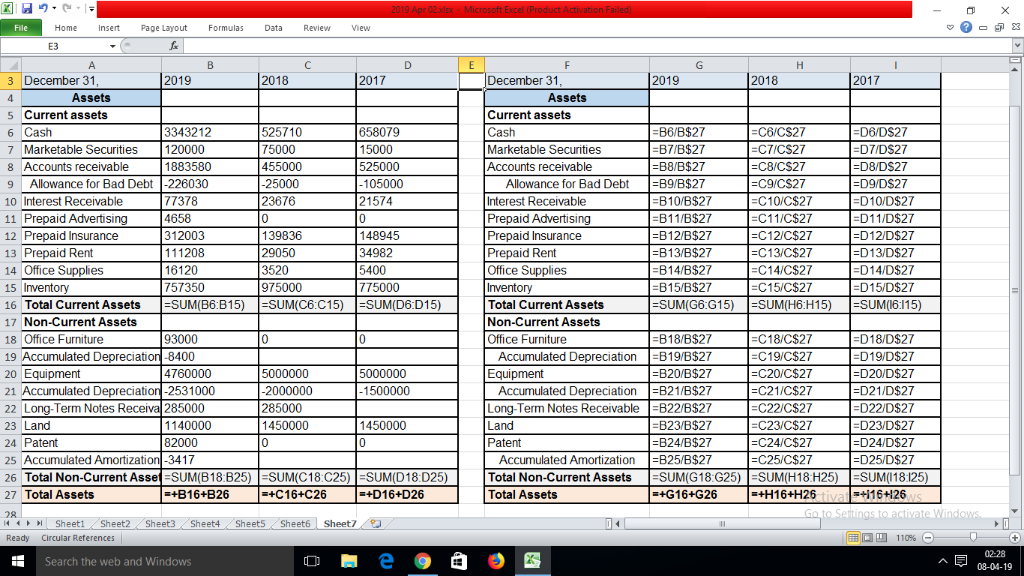
Formula View
 ekkarill92 answered 3 months ago
Related Solutions
COMPARATIVE BALANCE SHEET December 31, 2019 218 2017 Assets Current assets Cash $ 3,343,212 $525,710 $658,079...
COMPARATIVE BALANCE SHEET
December 31,
2019
218
2017
Assets
Current assets
Cash
$
3,343,212
$525,710
$658,079
Marketable Securities
120,000
75,000
15,000
Accounts receivable
1,883,580
455,000
525,000
Allowance for Bad Debt
(226,030)
(25,000)
(105,000)
Interest Receivable
77,378
23,676
21,574
Prepaid Advertising
4,658
-
-
Prepaid Insurance
312,003
139,836
148,945
Prepaid Rent
111,208
29,050
34,982
Office Supplies
16,120
3,520
5,400
Inventory
757,350
975,000
775,000
Total...
A comparative balance sheet for Crane Corporation is presented below. December 31 Assets 2020 2019 Cash...
A comparative balance sheet for Crane Corporation is presented
below.
December
31
Assets
2020
2019
Cash
$70720
$22880
Accounts receivable
85280
68640
Inventory
176800
196560
Land
73840
114400
Equipment
291200
208000
Accumulated depreciation–equipment
(76960)
(43680)
Total
$620880
$566800
Liabilities and Stockholders’ Equity
Accounts payable
$35360
$48880
Bonds payable
156000
208000
Common stock ($1 par)
170560
170560
Retained earnings
258960
139360
Total
$620880
$566800
Additional information:
1.
Net income for 2020 was $161200; there were no gains or
losses.
2.
Cash...
A comparative balance sheet for Talkington Corporation is presented below. December 31 Assets 2017 2016 Cash...
A comparative balance sheet for Talkington Corporation is
presented below.
December
31
Assets
2017
2016
Cash
$68,000
$22,000
Accounts receivable
82,000
66,000
Inventory
170,000
189,000
Land
71,000
110,000
Equipment
280,000
200,000
Accumulated depreciation–equipment
(74,000)
(42,000)
Total
$597,000
$545,000
Liabilities and Stockholders’ Equity
Accounts payable
$34,000
$47,000
Bonds payable
150,000
200,000
Common stock ($1 par)
164,000
164,000
Retained earnings
249,000
134,000
Total
$597,000
$545,000
Additional information:
1.
Net income for 2017 was $155,000; there were no gains or
losses.
2.
Cash...
A comparative balance sheet for Martinez Corporation is presented below. December 31 Assets 2017 2016 Cash...
A comparative balance sheet for Martinez Corporation is
presented below.
December 31
Assets
2017
2016
Cash
$ 72,870
$ 22,000
Accounts
receivable
83,730
67,860
Inventory
181,730
190,860
Land
72,730
111,860
Equipment
261,730
201,860
Accumulated
Depreciation-Equipment
( 70,730
)
( 43,860
)
Total
$ 602,060
$ 550,580
Liabilities
and Stockholders' Equity
Accounts
payable
$ 35,730
$ 48,860
Bonds payable
150,000
200,000
Common stock ($1
par)
214,000
164,000
Retained
earnings
202,330
137,720
Total
$ 602,060
$ 550,580
Additional information:
1.
Net income for 2017 was $...
A comparative balance sheet for Pearl Corporation is presented below. December 31 Assets 2017 2016 Cash...
A comparative balance sheet for Pearl Corporation is presented
below.
December 31
Assets
2017
2016
Cash
$ 72,800
$ 22,000
Accounts receivable
83,260
67,460
Inventory
181,260
190,460
Land
72,260
111,460
Equipment
261,260
201,460
Accumulated Depreciation-Equipment
(70,260
)
(43,460
)
Total
$600,580
$549,380
Liabilities and Stockholders' Equity
Accounts payable
$ 35,260
$ 48,460
Bonds payable
150,000
200,000
Common stock ($1 par)
214,000
164,000
Retained earnings
201,320
136,920
Total
$600,580
$549,380
Additional information:
1.
Net income for 2017 was $127,520. No gains...
Talbert Corp Comparative Balance Sheet December 31, 2017 December 31, 2016 Assets Cash 440,000 200,000 Short-Term...
Talbert Corp
Comparative Balance Sheet
December 31, 2017
December 31, 2016
Assets
Cash
440,000
200,000
Short-Term Investments
600,000
------------
Accounts Receivable (Net)
1,020,000
1,020,000
Inventory
1,380,000
1,200,000
Long-Term Investments
400,000
600,000
Plant Assets
3,400,000
2,000,0000
Accumulated Depreciation
(900,000)
(900,000)
Patent
180,000
200,0000
Total Assets
6,520,000
4,320,000
Liabilities and Stockholder’s Equity
A/P and Accrued Liabilities
1,660,000
1,440,000
Notes Payable (nontrade)
580,000
------------
Common Stock, $10 par
1,600,000
1,440,000
Additional Paid in Capital
800,000
500,000
Retained Earnings
1,880,000
980,000
Total Liabilities and...
A comparative balance sheet for Carla Corporation is presented as follows. December 31 Assets 2020 2019...
A comparative balance sheet for Carla Corporation is presented
as follows.
December 31
Assets
2020
2019
Cash
$ 72,880
$ 22,000
Accounts receivable
84,590
68,710
Inventory
182,590
191,710
Land
73,590
112,710
Equipment
262,590
202,710
Accumulated Depreciation-Equipment
(71,590
)
(44,710
)
Total
$604,650
$553,130
Liabilities and Stockholders' Equity
Accounts payable
$ 36,590
$ 49,710
Bonds payable
150,000
200,000
Common stock ($1 par)
214,000
164,000
Retained earnings
204,060
139,420
Total
$604,650
$553,130
Additional information:
1.
Net income for 2020 was $130,180. No...
A comparative balance sheet for Pharoah Corporation is presented as follows. December 31 Assets 2020 2019...
A comparative balance sheet for Pharoah Corporation is presented
as follows.
December 31
Assets
2020
2019
Cash
$ 72,800
$ 22,000
Accounts receivable
83,260
67,460
Inventory
181,260
190,460
Land
72,260
111,460
Equipment
261,260
201,460
Accumulated Depreciation-Equipment
(70,260
)
(43,460
)
Total
$600,580
$549,380
Liabilities and Stockholders' Equity
Accounts payable
$ 35,260
$ 48,460
Bonds payable
150,000
200,000
Common stock ($1 par)
214,000
164,000
Retained earnings
201,320
136,920
Total
$600,580
$549,380
Additional information:
1.
Net income for 2020 was $127,520. No...
A comparative balance sheet for Sarasota Corporation is presented as follows. December 31 Assets 2020 2019...
A comparative balance sheet for Sarasota Corporation is
presented as follows.
December 31
Assets
2020
2019
Cash
$ 72,680
$ 22,000
Accounts receivable
84,360
68,680
Inventory
182,360
191,680
Land
73,360
112,680
Equipment
262,360
202,680
Accumulated Depreciation-Equipment
(71,360
)
(44,680
)
Total
$603,760
$553,040
Liabilities and Stockholders' Equity
Accounts payable
$ 36,360
$ 49,680
Bonds payable
150,000
200,000
Common stock ($1 par)
214,000
164,000
Retained earnings
203,400
139,360
Total
$603,760
$553,040
Additional information:
1.
Net income for 2020 was $129,720. No...
A comparative balance sheet for Blossom Corporation is presented as follows. December 31 Assets 2020 2019...
A comparative balance sheet for Blossom Corporation is presented
as follows. December 31 Assets 2020 2019 Cash $ 72,800 $ 22,000
Accounts receivable 83,260 67,460 Inventory 181,260 190,460 Land
72,260 111,460 Equipment 261,260 201,460 Accumulated
Depreciation-Equipment (70,260 ) (43,460 ) Total $600,580 $549,380
Liabilities and Stockholders' Equity Accounts payable $ 35,260 $
48,460 Bonds payable 150,000 200,000 Common stock ($1 par) 214,000
164,000 Retained earnings 201,320 136,920 Total $600,580 $549,380
Additional information: 1. Net income for 2020 was $127,520. No...
ADVERTISEMENT
ADVERTISEMENT
Latest Questions
- Problem 18-12 Various shareholders' equity topics; comprehensive [LO18-1, 18-4, 18-5, 18-6, 18-7, 18-8] Part A In...
- Hello There, This is discussion Question For Advanced Database Systems Question: (a) Please define what a...
- Physicians at a clinic gave what they thought were drugs to 860860 patients. Although the doctors...
- On January 1, 2018, bonds with a face value of $ 79,000 were sold. The bonds...
- How do I make this sort in true alphabetical order instead of ascii(ABCabc) order? I am...
- As a healthcare provider in physical therapy, athletic training, or as an exercise scientist and personal...
- in the market for makeup artists, what happens after the invention of high-definition tv allowing viewers...
ADVERTISEMENT