Question
In: Math
The following output was obtained from a regression analysis of the dependent variable Rating and an...
- The following output was obtained from a regression analysis of the dependent variable Rating and an independent variable Price. (10 points)
|
ANOVA |
||||
|
df |
SS |
MS |
F |
|
|
Regression |
1 |
372.707 |
372.707 |
42.927 |
|
Residual |
15 |
130.234 |
8.682 |
|
|
Total |
16 |
502.941 |
||
|
Coefficients |
Standard Error |
t Stat |
P-value |
|
|
Intercept |
45.623 |
3.630 |
12.569 |
0.000 |
|
Price |
0.107 |
0.016 |
6.552 |
0.000 |
- Use the critical value approach to perform an F test for the significance of the linear relationship between Rating and Price at the 0.05 level of significance.
- Calculate the coefficient of determination.
- What percentage of the variability of Rating can be explained by its linear relationship with Price? What is the sample correlation coefficient?
- What is the estimated regression equation?
- Use the p-value approach to perform a t test for the significance of the linear relationship between Price and Rating at the 0.05 level of significance.
Solutions
Expert Solution
Solution:
Part a) Use the critical value approach to perform
an F test for the significance of the linear relationship between
Rating and Price at the 0.05 level of significance
df_N= 1
df_D = 15
Look in F table for df_N= 1 and df_D = 15
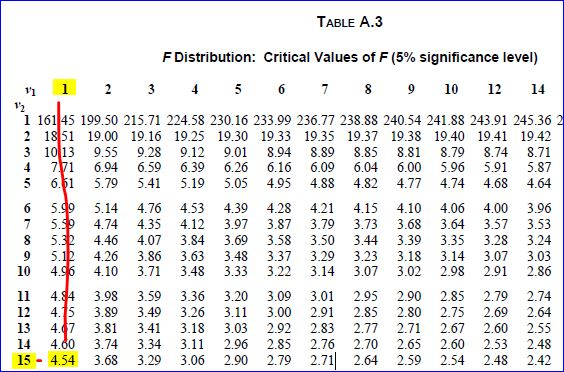
F critical value= 4.54
From ANOVA table , Fcalc = 42.927
Since Fcalc = 42.927 > F critical value= 4.54, we reject null hypothesis H0 and conclude that: there is significant linear relationship between Rating and Price at the 0.05 level of significance.
Part b) Calculate the coefficient of determination.

From ANOVA table,
SSR = 372.707
SST = 502.941
Thus


Part c) What percentage of the variability of Rating can be explained by its linear relationship with Price?

Thus 74.11 % of the variability of Rating can be explained by its linear relationship with Price.
What is the sample correlation coefficient?

the sample correlation coefficient r = 0.8608
Part d) What is the estimated regression equation?
Rating = 45.623 + 0.107 X Price
Part e) Use the p-value approach to perform a t test for the significance of the linear relationship between Price and Rating at the 0.05 level of significance.
From given table, P-value for slope of regression equation ( coefficient of Price) is = 0.000
Since this P-value = 0.000 < 0.05 level of significance, we conclude that : there is significant linear relationship between Price and Rating at the 0.05 level of significance.
 milcah answered 3 months ago
Related Solutions
The following output was obtained from a regression analysis of the dependent variable Rating and an...
PART B The following output was obtained from a regression analysis of the dependent variable Rating...
The following output was obtained from a regression analysis of the dependent variable Sales volume and...
The following regression output was obtained from a study of architectural firms. The dependent variable is...
The following regression output was obtained from a study of architectural firms. The dependent variable is...
The following regression output was obtained from a study of architectural firms. The dependent variable is...
The following regression output was obtained from a study of architectural firms. The dependent variable is...
The following regression output was obtained from a study of architectural firms. The dependent variable is...
The following regression output was obtained from a study of architectural firms. The dependent variable is...
The following regression output was obtained from a study of architectural firms. The dependent variable is...
- Graph a Monopoly. Compare the price, quantity, and ATC of a monopoly with a perfectly competitive...
- Problem 18-12 Various shareholders' equity topics; comprehensive [LO18-1, 18-4, 18-5, 18-6, 18-7, 18-8] Part A In...
- Hello There, This is discussion Question For Advanced Database Systems Question: (a) Please define what a...
- Physicians at a clinic gave what they thought were drugs to 860860 patients. Although the doctors...
- On January 1, 2018, bonds with a face value of $ 79,000 were sold. The bonds...
- How do I make this sort in true alphabetical order instead of ascii(ABCabc) order? I am...
- As a healthcare provider in physical therapy, athletic training, or as an exercise scientist and personal...