Question
In: Math
In this problem, assume that the distribution of differences is approximately normal. Note: For degrees of...
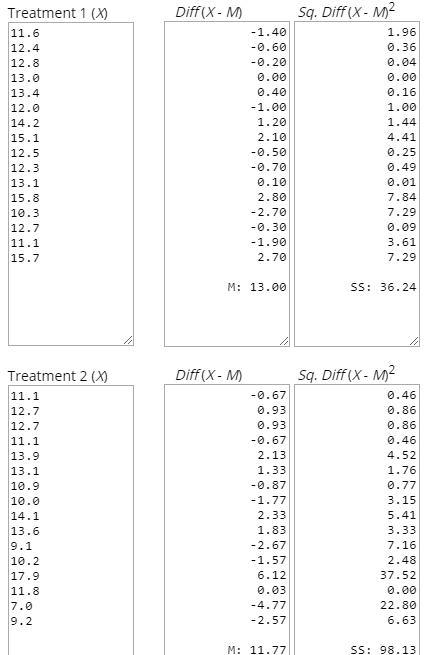
In this problem, assume that the distribution of differences is approximately normal. Note: For degrees of freedom d.f. not in the Student's t table, use the closest d.f. that is smaller. In some situations, this choice of d.f. may increase the P-value by a small amount and therefore produce a slightly more "conservative" answer. In the following data pairs, A represents birth rate and B represents death rate per 1000 resident population. The data are paired by counties in the Midwest. A random sample of 16 counties gave the following information. A: 11.6 12.4 12.8 13.0 13.4 12.0 14.2 15.1 B: 11.1 12.7 12.7 11.1 13.9 13.1 10.9 10.0 A: 12.5 12.3 13.1 15.8 10.3 12.7 11.1 15.7 B: 14.1 13.6 9.1 10.2 17.9 11.8 7.0 9.2 Do the data indicate a difference (either way) between population average birth rate and death rate in this region? Use α = 0.01. (Let d = A − B.)
What is the value of the sample test statistic? (Round your answer to three decimal places.)
(c) Find (or estimate) the P-value. (Round your answer to four decimal places.)
Solutions
Expert Solution
Solution :
for the analysis we have to use t- test for calculating difference between two sample mean i.e birth rate and death rate
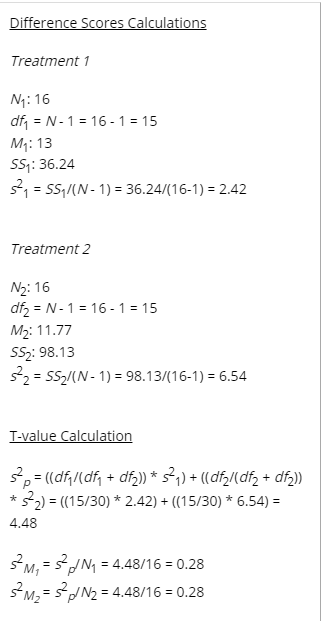
for calculation we take A = birth rate = Treatment 1 and B = deat rate = Treatment 2 now we do the following calculation for t- test
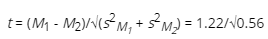
therefore t = 1.637
and p-value is 0.1120
hence we say that the p-value is not less than 0.01
therefore using p-value we sat that tha average of two sample is not same i.e average for birth rate and death rate is different
Thank you..!!
please like it ..
 milcah answered 5 months ago
Related Solutions
In this problem, assume that the distribution of differences is approximately normal. Note: For degrees of...
In this problem, assume that the distribution of differences is approximately normal. Note: For degrees of...
In this problem, assume that the distribution of differences is approximately normal. Note: For degrees of...
In this problem, assume that the distribution of differences is approximately normal. Note: For degrees of...
In this problem, assume that the distribution of differences is approximately normal. Note: For degrees of...
In this problem, assume that the distribution of differences is approximately normal. Note: For degrees of...
In this problem, assume that the distribution of differences is approximately normal. Note: For degrees of...
In this problem, assume that the distribution of differences is approximately normal. Note: For degrees of...
In this problem, assume that the distribution of differences is approximately normal. Note: For degrees of...
In this problem, assume that the distribution of differences is approximately normal. Note: For degrees of...
- mr. smith completed 9 years of fixed monthly payments of 3,333.28 on a 30 year loan...
- during the experiment, a student did not follow the procedure exactly as directed how will eact...
- Assume all temperatures to be exact, and neglect significant figures for small changes in dimension. When...
- why is Argentina a developing country ?
- Calculate the enthalpy of the reaction 4B(s)+3O2(g)?2B2O3(s) given the following pertinent information: B2O3(s)+3H2O(g)?3O2(g)+B2H6(g), ?H?A=+2035 kJ 2B(s)+3H2(g)?B2H6(g),  
- Do you think that CAFTA will have a major impact on the U.S. economy? Why?
- Assignment 4, Fraction Comparable Instructions For this assignment, you will be updating the Fraction class from...