Question

In: Economics

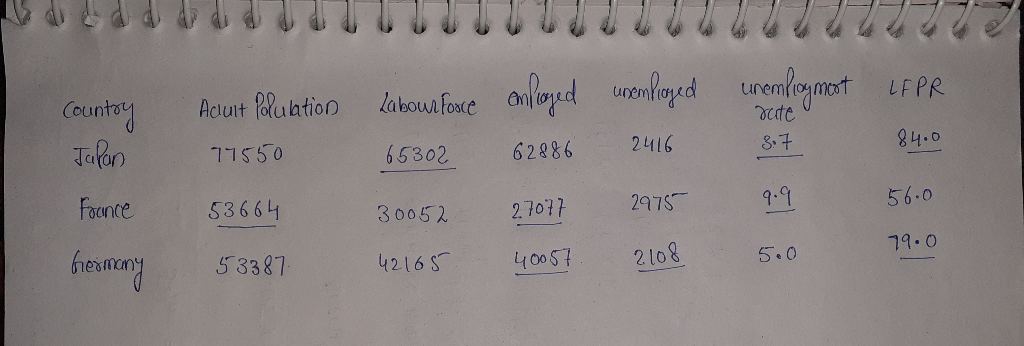
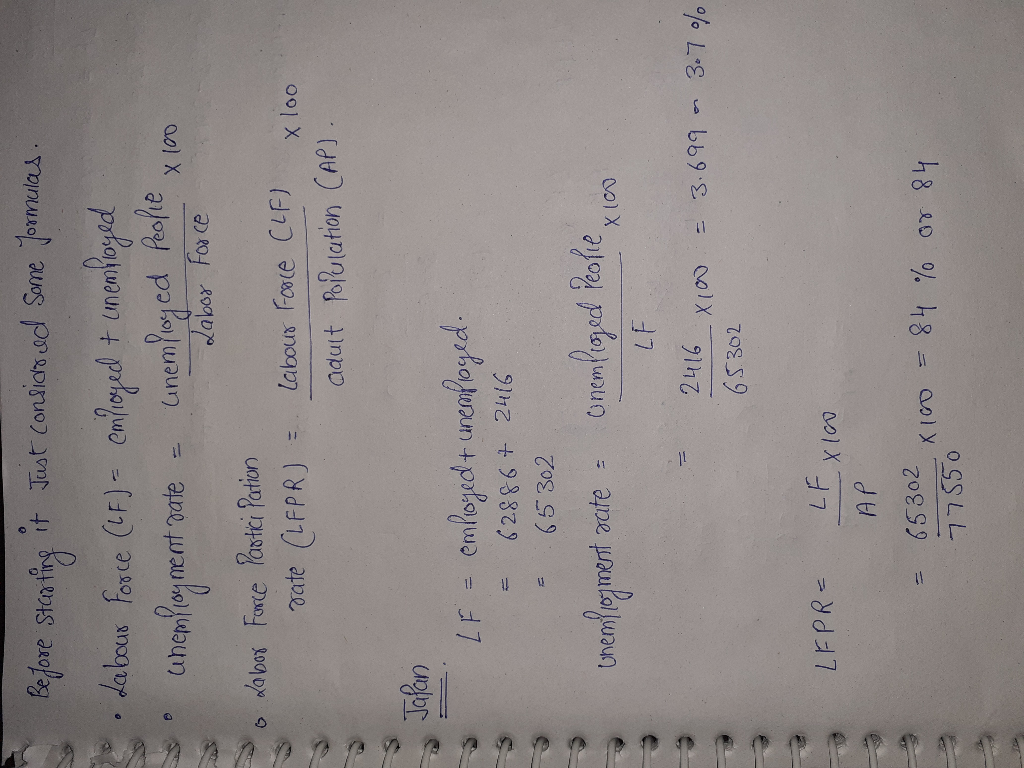
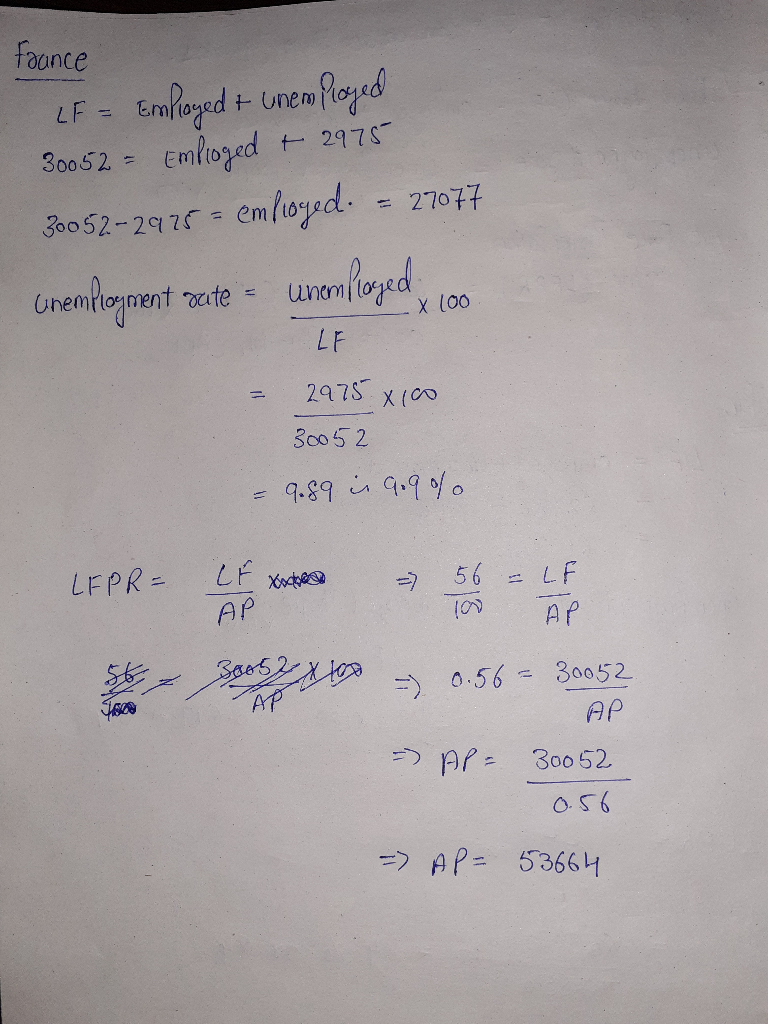
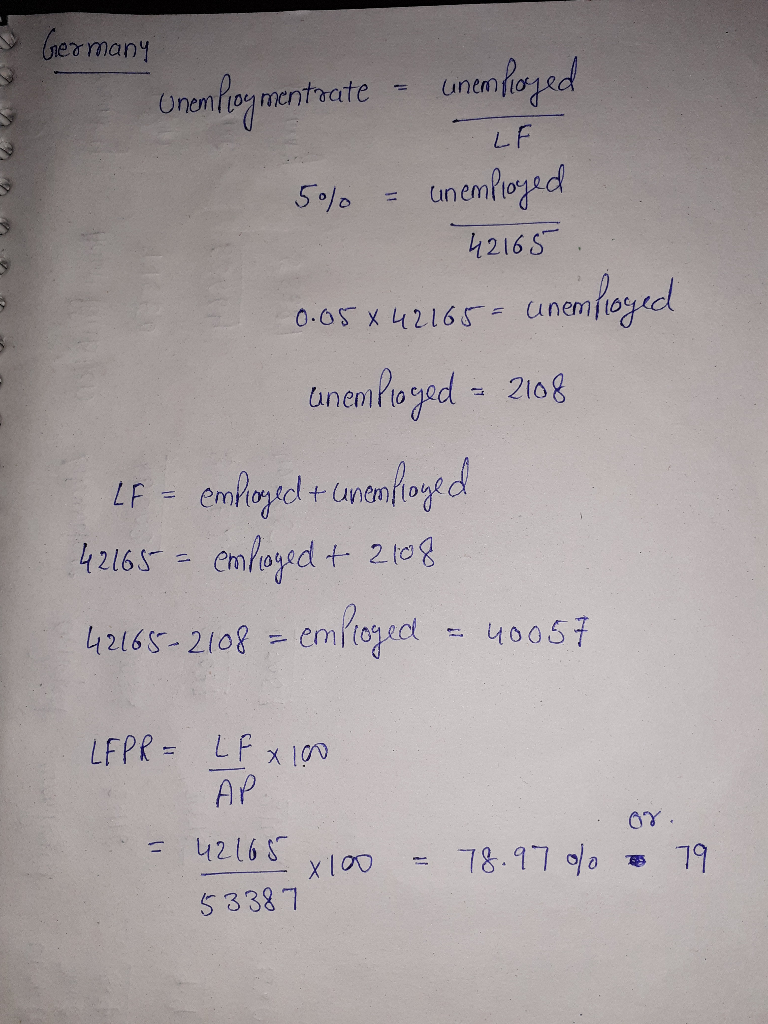
The table below uses data for the year 2014, adjusted to be comparable to each other....

The table below uses data for the year 2014, adjusted to be comparable to each other. All population values are in thousands.

Country Adult
population
Labour
force
Employed Unemployed Unemployment
rate (%)
Labour-force participation rate (%)
Japan 77,550 62,886 2,416
France 30,052 2,975 56.0
Germany 53,387 42,165 5.0


Instructions: Round your answers to one decimal place.

a. Fill in the blanks in the table above.

b. In part a, you should have found that the unemployment rates of the three countries differ significantly from one another. Select the possible reasons to explain why the countries might have different unemployment rates.


Germany could be in a recession and have higher cyclical unemployment, or .Germany could have more powerful unions. or Germany could have higher (and binding) minimum wages. or Japan could have a more liberalized labour market leading to lower frictional unemployment. or Germany and France could have more generous employment benefits. or All of the choices are correct.

Solutions

Expert Solution


Related Solutions

The data in the table, from a survey of resort hotels with comparable rates on Hilton...
The data in the table, from a survey of resort hotels with comparable rates on Hilton Head Island, show that room occupancy during the off-season (November through February) is related to the price charged for a basic room. Price per Day $ Occupancy Rate % 104 53 134 47 143 46 149 45 164 40 194 32 First make a linear equation using linear regression on your calculator where x = price and y = occupancy rate. Convert occupancy rate...
The adjusted trial balance data given below is from the Morgan Company’s worksheet for the year...
The adjusted trial balance data given below is from the Morgan Company’s worksheet for the year ended December 31, 2019. The expense accounts numbered 611-615 represent selling expenses, and those numbered 621-631 represent general and administrative expenses. ACCT.      ADJUSTED TRIAL BALANCE      NO.   ACCOUNT NAME      DEBIT      CREDIT      399   Income Summary      65,000      60,000      401   Sales            310,000      451   Sales Returns and Allowances      4,500            491   Interest Income     ...
The adjusted trial balance data given below is from the Morgan Company’s worksheet for the year...
The adjusted trial balance data given below is from the Morgan Company’s worksheet for the year ended December 31, 2019. The expense accounts numbered 611-615 represent selling expenses, and those numbered 621-631 represent general and administrative expenses. ACCT. ADJUSTED TRIAL BALANCE NO. ACCOUNT NAME DEBIT CREDIT 399 Income Summary 73,000 64,000 401 Sales 390,000 451 Sales Returns and Allowances 5,300 491 Interest Income 890 501 Purchases 195,000 502 Freight In 4,400 503 Purchases Returns and Allowances 3,000 504 Purchases Discounts...
Below are the quality costs data for a company for 2014 & 2015 2014 2015 Prevention...
Below are the quality costs data for a company for 2014 & 2015 2014 2015 Prevention $90,000 $110,000 Appraisal $50,000 $62,000 Internal Faliure $40,000 $34,000 External Faliure $62,000 $60,000 Sales: $5,100,000 $5,350,000 A) whats the precentage change in the total quality index between 2014 & 2015 B) What is the percentage change in the precention quality index between 2014 & 2015 C) What is the percentage change in the internal faliure quality index between 2014 & 2015 ? D) Do...
The adjusted trial balance for Lifesaver Corp. at the end of the current year, 2014, contained...
The adjusted trial balance for Lifesaver Corp. at the end of the current year, 2014, contained the following accounts. 5-year Bonds Payable 8% $2,500,000 Interest Payable 50,000 Premium on Bonds Payable 100,000 Notes Payable (3 months.) 40,000 Notes Payable (5 yr.) 165,000 Mortgage Payable ($15,000 due currently) 200,000 Salaries and wages Payable 18,000 Income Taxes Payable (due 3/15 of 2015) 25,000 The total long-term liabilities reported on the balance sheet are A) $2,865,000. B) $2,850,000. C) $2,965,000. D) $2,950,000.
The table below shows the number of students in each year at a certain university: Year...
The table below shows the number of students in each year at a certain university: Year of study 1 2 3 4 5 6 7 No. of students 300 280 275 175 92 48 30 You would like to select a random sample of 100 students from this university. i. Explain how you would choose a simple random sample. ii. Explain how you would choose a sample using systematic (interval) sampling method. iii. If you use stratified sampling method to...
Use the data provided below and calculate: Nominal GNP for 2014 and 2015. Assuming 2014 is...
Use the data provided below and calculate: Nominal GNP for 2014 and 2015. Assuming 2014 is the base year, calculate price index for 2015. Real GNP for 2014 and 2015. Inflation rate from 2014 to 2015. Real and nominal rates of economic growth from 2014 to 2015. (Note, rate of change is measured by “absolute change” from one year to another divided by what the GNP was in the previous year. Goods & Services Price 2014 Quantity 2015 Price 2015...
The table below lists the prices and quantities consumed of three different goods from 2014−2016. 2014...
The table below lists the prices and quantities consumed of three different goods from 2014−2016. 2014 2015 2016 Good Price ($) Quantity Price ($) Quantity Price ($) Quantity A 12 8 16 6 18 5 B 5 18 3 30 4 25 C 1 10 2 5 5 10 a. For 2014, 2015, and 2016, determine the amount that a typical consumer pays each year to purchase the quantities listed in the table above. Instructions: Round your answers to the...
Data Table Two below Data Table Two Year Quarter Number of Visitors(in thousands) 2005 Winter 117...
Data Table Two below Data Table Two Year Quarter Number of Visitors(in thousands) 2005 Winter 117 Spring 80.7 Summer 129.6 Fall 76.1 2006 Winter 118.6 Spring 82.5 Summer 121.4 Fall 77 2007 Winter 114 Spring 84.3 Summer 119.9 Fall 75 2008 Winter 120.7 Spring 79.6 Summer 130.7 Fall 69.6 2009 Winter 125.2 Spring 80.2 Summer 127.6 Fall 72 Please post the answer with the work performed in excel and not just the answer, need to show work as I don't...
ADVERTISEMENT
ADVERTISEMENT
ADVERTISEMENT