Question
In: Statistics and Probability
10 research participants were administered an anxiety test under both noisy and quiet conditions. The data...
10 research participants were administered an anxiety test under both noisy and quiet conditions. The data are as follows: Using SPSS
|
Participant |
Noisy |
Quiet |
|
1 |
16 |
10 |
|
2 |
5 |
3 |
|
3 |
12 |
10 |
|
4 |
9 |
5 |
|
5 |
23 |
15 |
|
6 |
7 |
8 |
|
7 |
13 |
12 |
|
8 |
21 |
17 |
|
9 |
10 |
15 |
|
10 |
5 |
25 |
- What is the mean and standard deviation for anxiety in the quiet condition?
- What is the mean and standard deviation for anxiety in the noisy condition?
- What is the mean difference score?
- How would you report the finding of this analysis in a written report? Be sure to include both the numerical report and a written interpretation.
- Compute the value of eta-squared and interpret this value.
Solutions
Expert Solution
Solution:
A)
The sample standard deviation for quiet condition can be calculated as:
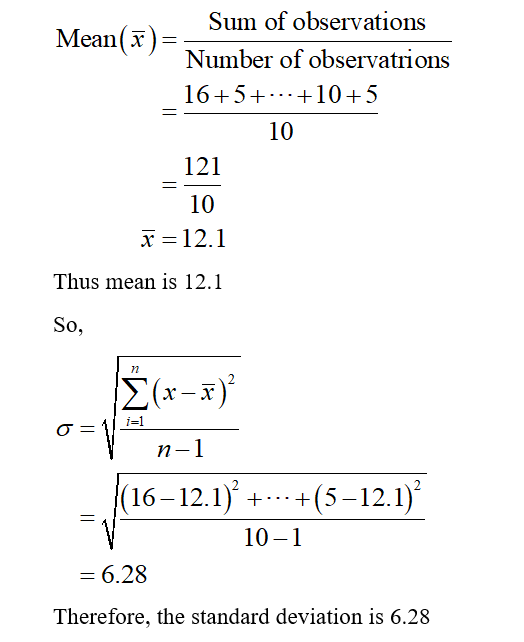
B)
The sample standard deviation for quiet condition can be calculated as:

C)
The mean difference score between quiet condition and the noisy condition is 0.1 (12.1 - 12)
D)
From the above information, it can be concluded that the mean for quiet and noisy are quite similar which is 12 and 12.1 respectively. Also, the standard deviation for quiet and noisy are 6.28 and 6.378 respectively. it means anxiety test under quiet conditions is pretty well as compare to noisy conditions.
 orchestra answered 3 years ago
Related Solutions
A study of the effects of color on easing anxiety compared anxiety test scores of participants...
1. Two versions of a test are administered to a reference group of participants and based...
6. A test is administered on two occasions to a reference group of participants and based...
A pool of participants was randomly divided into FIVE treatment groups. The groups were administered daily...
A pool of participants was randomly divided into FIVE treatment groups. The groups were administered daily...
Forty-eight participants were randomly assigned to do math tasks under one of three conditions: 16 while...
The following data contains the data for a group of participants that took a timed test....
The following data on x = score on a measure of test anxiety and y =...
DATA SET 2 The following data were obtained from a research study comparing two treatment conditions....
Two brands of car batteries, both carrying 6-year warranties, were sampled and tested under controlled conditions....
- sort_employees(Employee emps[], int size) (40 pts) This function should sort the input array based on each...
- Write the program in JAVA. Make an undirected, but disconnected graph of at least 15 vertices...
- Teen Smoking Project CHAPTER 0. Preliminary Discussion Question: 1. What conjectures (educated guesses) could be made...
- In reviewing firm liquidity situations, lenders often count on the Quick Ratio (or Acid-Test ratio). Why...
- code a Java program that: Requests from the user for a text filename to read the...
- Discuss how the ARIES algorithm must operate under the circumstances that the system crashes during recovery
- (a) Based on the information in the above table, what is the unemployment rate? What is...