Question
In: Math
Suppose 140 geology students measure the mass of an ore sample. Due to human error and...
Suppose
140
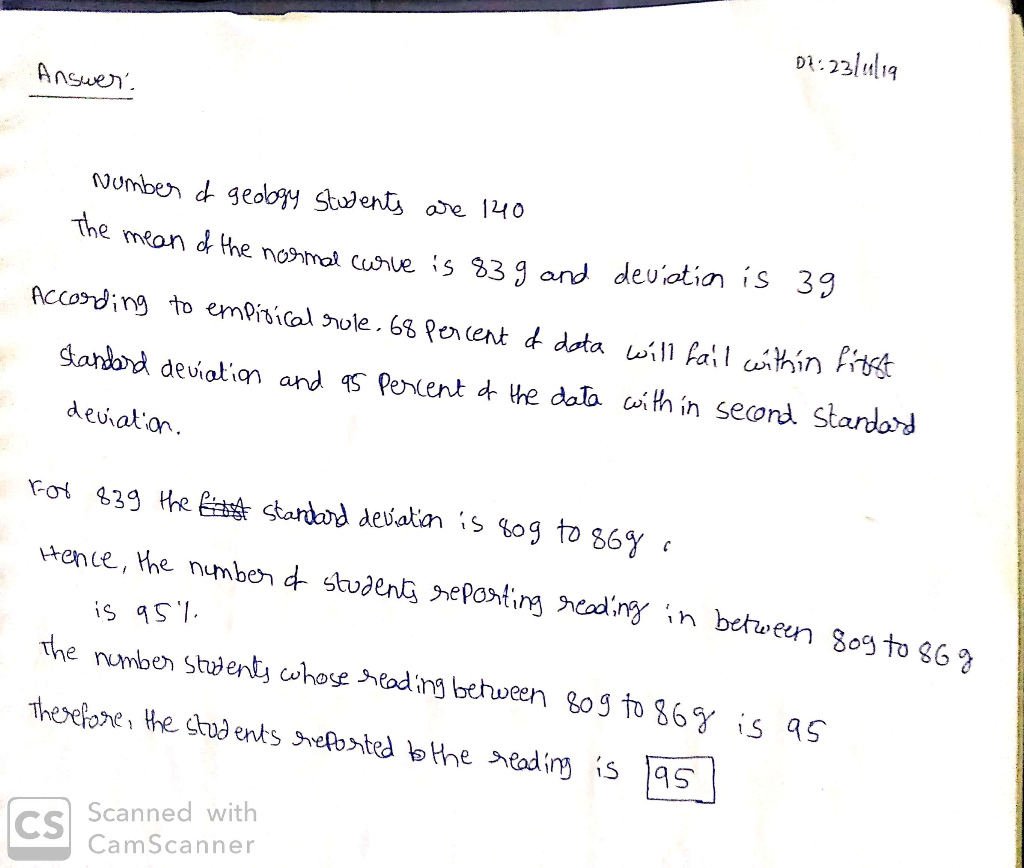
geology students measure the mass of an ore sample. Due to human error and limitations in the reliability of the balance, not all the readings are equal. The results are found to closely approximate a normal curve, with mean
83
g and standard deviation
3
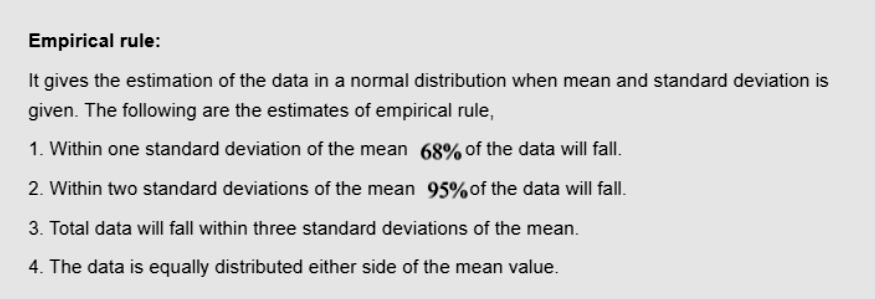
g. Use the symmetry of the normal curve and the empirical rule as needed to estimate the number of students reporting readings between
80
g and
86
g.
Solutions
 milcah answered 8 months ago
Related Solutions
Suppose 130 geology students measure the mass of an ore sample. Due to human error and...
Suppose 130 geology students measure the mass of an ore sample.
Due to human error and limitations in the reliability of the
balance, not all the readings are equal. The results are found to
closely approximate a normal curve, with mean
82g and standard deviation
1g. Use the symmetry of the normal curve and the empirical rule
as needed to estimate the number of students reporting readings
between 79
g and 85g.
The mass of a sample or iron ore is known to be 35.714 grams. You measure...
The mass of a sample or iron ore is known to be 35.714 grams.
You measure the mass of this sample using three different scales
and obtain the following masses: 36.2 g, 35 g, 34.9 g and 35.9 g.
The accepted tolerance for both error and for accuracy is 2%. With
respect to accuracy and precision, how would you best describe
these measurements? Hint: Determine the average mass, absolute
deviation for each trail, the M.A.D, and Relative Deviation
(percent).
A sample of a copper ore with a mass of 0.4225 g was dissolved in acid....
A sample of a copper ore with a mass of 0.4225 g was dissolved
in acid. A solution of potassium iodide was added, which caused the
reaction:
2Cu2+(aq) + 5I
26. a correlated sample t test minimizes a most important type of random error namely that error due to
26. a correlated sample t test minimizes a most important type of random error namely that error due to
a. individual differences
b. measurement deficiencies
c. equipment breakdowns
d. any uncontrolled factors
e. instrument unreliabilty
27. Refer to the following parenthetical statement appearing in a published report [x2(3, n = 56) = 11.69, p < 0.01]
The p-value of less than 0.01 associated the chi-square test reflects a very
a. common event that fails to support the...
A group of students measure the length and width of a random sample of beans. They...
A group of students measure the length and width of a random
sample of beans. They are interested in investigating the
relationship between the length and width. Their summary statistics
are displayed in the table below. All units, if applicable, are
millimeters.
Mean width:
7.647
Stdev width:
0.942
Mean height:
13.924
Stdev height:
1.703
Correlation coefficient:
0.7443
a) The students are interested in using the width of the beans
to predict the height. Calculate the slope of the regression
equation....
A group of students measure the length and width of a random sample of beans. They...
A group of students measure the length and width of a random
sample of beans. They are interested in investigating the
relationship between the length and width. Their summary statistics
are displayed in the table below. All units, if applicable, are
millimeters.
Mean width: 7.439 Stdev width: 0.88 Mean height: 13.625 Stdev
height: 1.825 Correlation coefficient: 0.7963
a) The students are interested in using the width of the beans
to predict the height. Calculate the slope of the regression
equation....
they survey a sample of n= 25 music major students. participants respond to a measure of...
they survey a sample of n= 25 music major students. participants
respond to a measure of creativity and the average score for the
sample is M=64. it is known that the distribution of creativity
scores for the population of college students is normal with m=53.
if the standard deviation is 40, it is the result sufficient to
conclude that there is a significant difference?
Fail to reject or reject null hypothesis?
significant difference in creativity score or no significant
difference...
Suppose there are 54% female students on CMU campus. A random sample of 100 students was...
Suppose there are 54% female students on CMU campus. A random
sample of 100 students was obtained. What is the probability there
will be equal to or more than 58 female students?
We measure the self-esteem scores for a sample of freshman. The population of college students has...
We measure the self-esteem scores for a sample of freshman. The
population of college students has a mean self-esteem score of µ =
55 and σ = 135. The data for our freshman are as follows:
44
55
39
17
27
38
36
24 36
Summarize the sample data (that is, find the mean and standard
deviation).
If we ask whether our sample of freshmen is different from the
typical college student, is that a one-tail test or a...
Answer the following questions a.)A researcher measure school majors for a sample of n=50 students at...
Answer the following questions
a.)A researcher measure school majors for a sample of n=50
students at XYZ college. Which measure of dental tendency would be
appropriate to summarize the measurements?
Mode
Mean
Median
Any of the three measure could be used
b.The range is relatively limited measure of because
Actually the range is construe best measure of variability for
all sample
All the options are correct
The calculation of the range involves only the lowest and
highest scores and infinite’s...
ADVERTISEMENT
ADVERTISEMENT
Latest Questions
- The output of the function is a dictionary whose keys represent the bins and whose values...
- The shape of a graph of a binomial distribution depends on the value of both n...
- In 2012, cost per Medicare beneficiary did what?
- 3. A. What techniques can a firm use to optimize demand deposit holdings? B. How do...
- The half-life of mercury-197 is 64.1 hours. If a patient undergoing a kidney scan is given...
- Double bonds react with Br2 to form a dibromide. Isobutylene undergoes cationic polymerization under conditions where...
- 1. Which sex chromosomes are limited to only one sex? A. X and Z B. X...
ADVERTISEMENT