Question
In: Math
home / study / math / statistics and probability / statistics and probability questions and answers...
home / study / math / statistics and probability / statistics and probability questions and answers / a physician wants to know if the number of male esophageal cancer patients diagnosed with multiple ...
Question: A physician wants to know if the number of male esophageal cancer patients diagnosed with multipl...
Edit question
A physician wants to know if the number of male esophageal cancer patients diagnosed with multiple primary tumors differs from the proportion of female esophageal cancer patients with the same diagnosis. She selects random samples of 60 male and 40 female esophageal cancer patients and records the number in each sample diagnosed with multiple primary tumors. 40 men and 10 women with multiple primary tumors are identified.
What is the null hypothesis for this study?
If the tabulated critical value of the chi-square statistic for the 5% level of significance is 3.84, what is the most appropriate conclusion that can be drawn from this study?
The proportion of male esophageal cancer patients diagnosed with multiple primary tumors differs from the proportion of female esophageal cancer patients diagnosed with such tumors (p<0.05).
The proportion of male esophageal cancer patients diagnosed with multiple primary tumors does not differ from the proportion of female esophageal cancer patients diagnosed with such tumors (p>0.05).
It is 95% certain that the proportion of male esophageal cancer patients diagnosed with multiple primary tumors equals the proportion of female esophageal cancer patients diagnosed with such tumors.
The investigator can be 95% certain that more men than women have esophageal cancer.
Which of the following statements is an accurate interpretation of the p-value associated with the study conclusion?
The observed difference in sample frequencies is likely to be due to random chance.
The probability of obtaining the given sample results by random chance is less than 5%.
The sample sizes are too small to detect a significant difference in frequency.
The investigator can be certain that the proportion of men diagnosed with multiple primary tumors differs from the proportion of women with the same diagnosis.
The proportion of male esophageal cancer patients with multiple primary tumors is greater than that of female esophageal cancer patients with such tumors.
An association exists between gender and the presence of multiple primary tumors.
The proportion of men with esophageal cancer differs from that of women esophageal cancer.
The proportion of male esophageal cancer patients diagnosed with multiple primary tumors does not differ from that of female esophageal cancer patients diagnosed with multiple primary tumors.
The calculated value of the test statistic is:
0.65
16.67
14.04
0.72
Solutions
Expert Solution
The null hypothesis is:
The proportion of male esophageal cancer patients diagnosed with multiple primary tumors equals the proportion of female esophageal cancer patients diagnosed with such tumors.
---------------------
Following is the two by two contingency table:
| Mutliple Primary tumors | |||
| Yes | No | Total | |
| Male | 40 | 20 | 60 |
| Female | 10 | 30 | 40 |
| Total | 50 | 50 | 100 |
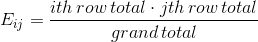
Expected frequencies will be calculated as follows:
Following table shows the expected frequencies;
| Multiple Primary tumors | |||
| Yes | No | Total | |
| Male | 30 | 30 | 60 |
| Female | 20 | 20 | 40 |
| Total | 50 | 50 | 100 |
Following table shows the calculations for chi square test statistics:
| O | E | (O-E)^2/E |
| 40 | 30 | 3.333333333 |
| 10 | 20 | 5 |
| 20 | 30 | 3.333333333 |
| 30 | 20 | 5 |
| Total | 16.66666667 |
Following is the test statistics:
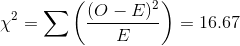
Degree of freedom: df =( number of rows -1)*(number of columns-1) = (2-1)*(2-1)=1
The p-value using excel function "=CHIDIST(16.67,1)" is: 0.000
Since p-value is less than 0.05 so we reject the null hypothesis.
Correct option:
The proportion of male esophageal cancer patients diagnosed with multiple primary tumors differs from the proportion of female esophageal cancer patients diagnosed with such tumors (p<0.05).
Correct option:
The probability of obtaining the given sample results by random chance is less than 5%.
The calculated value of the test statistic is: 16.67
 milcah answered 9 months ago
Related Solutions
home / study / math / statistics and probability / statistics and probability questions and answers...
home / study / math / statistics and probability / statistics and probability questions and answers...
home / study / math / statistics and probability / statistics and probability questions and answers...
home / study / math / statistics and probability / statistics and probability questions and answers...
home / study / math / statistics and probability / statistics and probability questions and answers...
home / study / math / statistics and probability / statistics and probability questions and answers...
home / study / math / statistics and probability / statistics and probability questions and answers...
home / study / math / statistics and probability / statistics and probability questions and answers...
home / study / math / advanced math / advanced math questions and answers / The...
home / study / science / nursing / nursing questions and answers / This Is A...
- Dirac's Theorem states that "A simple graph with n vertices (n >= 3) is Hamiltonian if...
- Two 10-cm-diameter charged rings face each other, 15cm apart. The left ring is charged to -29nC...
- Under what conditions would it be possible for an excise tax to have no efficiency cost...
- explain the difference between activities and financial statements of service businesses and merchandising businesses.
- 2. Compare and compare the matrix multiplication algorithm and the Floyd-Warshall algorithm to find all pairs...
- Q: 50.00 ml of 0.5216 M copper(II) nitrate solution is combined with 100.0 ml of 0.5580...
- This is a business law question. Explain how environmental laws regulate the use of toxic substances...