Question
In: Math
Let x be the average number of employees in a group health insurance plan, and let...
Let x be the average number of employees in a group health insurance plan, and let y be the average administrative cost as a percentage of claims.
x 3 7 15 39 73
y 40 35 30 25 20
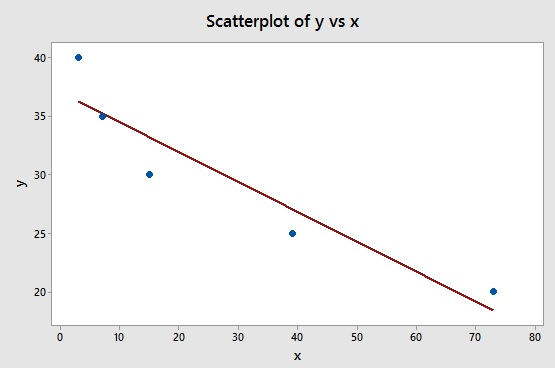
(a) Make a scatter diagram of the data and visualize the line you think best fits the data.
(b) Would you say the correlation is low, moderate, or strong? positive or negative?pLEASE SELECT CORRECT ANSWER
moderate and positive
low and negative
moderate and negative
low and positive
strong and positive
strong and negative
(c) Use a calculator to verify that Σx = 137, Σx2 = 7133, Σy = 150, Σy2 = 4750, and Σxy = 3250. Compute r. (Round your answer to three decimal places.) r =
As x increases, does the value of r imply that y should tend to increase or decrease? Explain. SELECT CORRECT ANSWER
Given our value of r, y should tend to decrease as x increases.
Given our value of r, y should tend to increase as x increases.
Given our value of r, y should tend to remain constant as x increases.
Given our value of r, we cannot draw any conclusions for the behavior of y as x increases.
Solutions
Expert Solution
(a)
----------------------------------------------------------------------------------------------------------------------------------------------------------------------------------------------------------
(b)
As the line is downward sloping here there is negetive correlation between x and y.
And the correlation is strong.
hence strong and negetive
-------------------------------------------------------------------------------------------------------------------------------------------------------------------------------------------------------------
(c)
verification

Required calculation for correlation
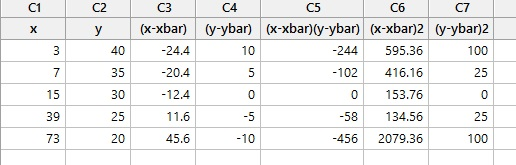

r=-0.936
negetive correlation
Given our value of r, y should tend to decrease as x increases.
----------------------------------------------------------------------------------------------------------------------------------------------------------------------------------------------------------
PLEASE UPVOTE IF YOU LIKE MY ANSWER.
 milcah answered 8 months ago
Related Solutions
Let x be the average number of employees in a group health insurance plan, and let...
Let x be the average number of employees in a group health insurance plan, and let...
Let x be the average number of employees in a group health insurance plan, and let...
Let x be the average number of employees in a group health insurance plan, and let...
Let x be the average number of employees in a group health insurance plan, and let...
Let x be the average number of employees in a group health insurance plan, and let...
Let x be the average number of employees in a group health insurance plan, and let...
Let x be the average number of employees in a group health insurance plan, and let...
A. Let x be the average number of employees in a group health insurance plan, and...
If a company provides a group hospitalization insurance plan for all employees and charges each employee...
- Students performed a procedure similar to Part III of this experiment (Analyzing a Vitamin Supplement for...
- The output of the function is a dictionary whose keys represent the bins and whose values...
- The shape of a graph of a binomial distribution depends on the value of both n...
- In 2012, cost per Medicare beneficiary did what?
- 3. A. What techniques can a firm use to optimize demand deposit holdings? B. How do...
- The half-life of mercury-197 is 64.1 hours. If a patient undergoing a kidney scan is given...
- Double bonds react with Br2 to form a dibromide. Isobutylene undergoes cationic polymerization under conditions where...