Question
In: Accounting
Simon Company’s year-end balance sheets follow. At December 31 Current Yr 1 Yr Ago 2 Yrs...
Simon Company’s year-end balance sheets follow.
| At December 31 | Current Yr | 1 Yr Ago | 2 Yrs Ago | ||||||
| Assets | |||||||||
| Cash | $ | 31,200 | $ | 34,800 | $ | 37,400 | |||
| Accounts receivable, net | 89,400 | 62,100 | 57,500 | ||||||
| Merchandise inventory | 50,220 | 82,300 | 50,000 | ||||||
| Prepaid expenses | 10,260 | 9,166 | 3,444 | ||||||
| Plant assets, net |
358,920 |
261,634 | 161,656 | ||||||
| Total assets | $ | 540,000 | $ | 450,000 | $ | 310,000 | |||
| Liabilities and Equity | |||||||||
| Accounts payable | $ | 134,460 | $ | 75,289 | $ | 39,692 | |||
| Long-term notes payable secured by mortgages on plant assets |
101,520 | 104,535 | 67,140 | ||||||
| Common stock, $10 par value | 162,500 | 162,500 | 162,500 | ||||||
| Retained earnings | 141,520 | 107,676 | 40,668 | ||||||
| Total liabilities and equity | $ | 540,000 | $ | 450,000 | $ | 310,000 | |||
The company’s income statements for the Current Year and 1 Year
Ago, follow.
| For Year Ended December 31 | Current Yr | 1 Yr Ago | ||||||||||
| Sales | $ | 702,000 | $ | 535,500 | ||||||||
| Cost of goods sold | $ | 428,220 | $ | 348,075 | ||||||||
| Other operating expenses | 217,620 | 135,482 | ||||||||||
| Interest expense | 11,934 | 12,317 | ||||||||||
| Income tax expense | 9,126 | 8,033 | ||||||||||
| Total costs and expenses | 666,900 | 503,907 | ||||||||||
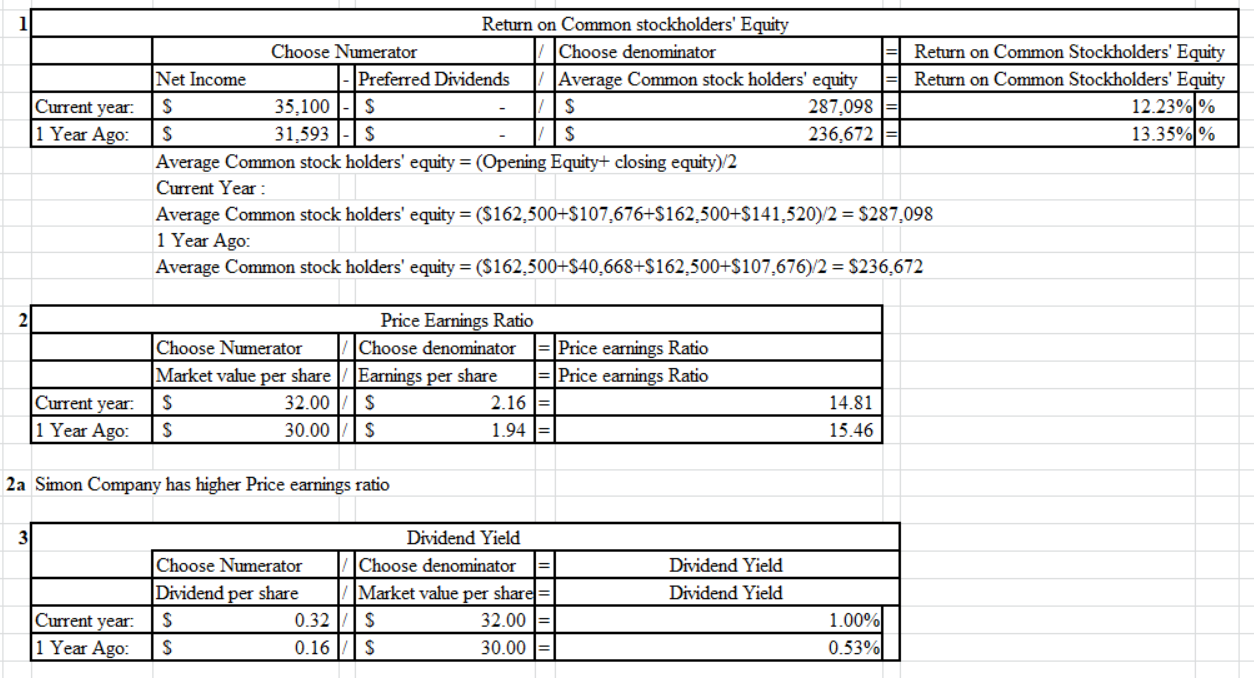
| Net income | $ | 35,100 | $ | 31,593 | ||||||||
| Earnings per share | $ | 2.16 | $ | 1.94 | ||||||||
Additional information about the company follows.
| Common stock market price, December 31, Current Year | $ | 32.00 |
| Common stock market price, December 31, 1 Year Ago | 30.00 | |
| Annual cash dividends per share in Current Year | 0.32 | |
| Annual cash dividends per share 1 Year Ago | 0.16 | |
For both the Current Year and 1 Year Ago, compute the following
ratios:
1. Return on common stockholders' equity.
2. Price-earnings ratio on December 31.
2a. Assuming Simon's competitor has a
price-earnings ratio of 8, which company has higher market
expectations for future growth?
3. Dividend yield.
Solutions
 ekkarill92 answered 9 months ago
Related Solutions
Simon Company’s year-end balance sheets follow. At December 31 Current Yr 1 Yr Ago 2 Yrs...
Simon Company’s year-end balance sheets follow.
At December 31
Current Yr
1 Yr Ago
2 Yrs Ago
Assets
Cash
$
31,800
$
35,625
$
37,800
Accounts receivable, net
89,500
62,500
50,200
Merchandise inventory
112,500
82,500
54,000
Prepaid expenses
10,700
9,375
5,000
Plant assets, net
278,500
255,000
230,500
Total assets
$
523,000
$
445,000
$
377,500
Liabilities and Equity
Accounts payable
$
129,900
$
75,250
$
51,250
Long-term notes payable secured by
mortgages on plant assets
98,500
101,500
83,500
Common stock,...
Simon Company’s year-end balance sheets follow. At December 31 Current Yr 1 Yr Ago 2 Yrs...
Simon Company’s year-end balance sheets follow. At December 31
Current Yr 1 Yr Ago 2 Yrs Ago Assets Cash $ 26,088 $ 30,494 $
31,765 Accounts receivable, net 89,100 62,800 50,100 Merchandise
inventory 112,500 84,500 53,000 Prepaid expenses 8,401 8,005 3,529
Plant assets, net 210,547 199,232 185,706 Total assets $ 446,636 $
385,031 $ 324,100 Liabilities and Equity Accounts payable $ 110,100
$ 64,420 $ 42,353 Long-term notes payable secured by mortgages on
plant assets 83,128 87,672 70,910 Common stock,...
Simon Company’s year-end balance sheets follow. At December 31 Current Yr 1 Yr Ago 2 Yrs...
Simon Company’s year-end balance sheets follow.
At December 31
Current Yr
1 Yr Ago
2 Yrs Ago
Assets
Cash
$
28,075
$
31,842
$
32,206
Accounts receivable, net
79,758
57,430
42,941
Merchandise inventory
98,255
75,138
46,195
Prepaid expenses
9,131
8,273
3,687
Plant assets, net
255,915
233,467
203,571
Total assets
$
471,134
$
406,150
$
328,600
Liabilities and Equity
Accounts payable
$
114,966
$
67,953
$
44,243
Long-term notes payable secured by
mortgages on plant assets
88,573
93,415
71,168
Common stock,...
Simon Company’s year-end balance sheets follow. At December 31 Current Yr 1 Yr Ago 2 Yrs...
Simon Company’s year-end balance sheets follow. At December 31
Current Yr 1 Yr Ago 2 Yrs Ago Assets Cash $ 31,900 $ 34,900 $
37,100 Accounts receivable, net 88,300 62,800 55,300 Merchandise
inventory 75,102 84,700 54,400 Prepaid expenses 11,546 9,148 4,222
Plant assets, net 383,152 248,452 228,978 Total assets $ 590,000 $
440,000 $ 380,000 Liabilities and Equity Accounts payable $ 142,503
$ 72,129 $ 49,157 Long-term notes payable secured by mortgages on
plant assets 108,702 100,188 86,499 Common stock,...
Simon Company’s year-end balance sheets follow. At December 31 Current Yr 1 Yr Ago 2 Yrs...
Simon Company’s year-end balance sheets follow.
At December 31
Current Yr
1 Yr Ago
2 Yrs Ago
Assets
Cash
$
33,501
$
39,160
$
40,792
Accounts receivable, net
89,100
62,600
50,000
Merchandise inventory
113,500
83,500
59,000
Prepaid expenses
10,789
10,280
4,532
Plant assets, net
326,667
298,906
261,876
Total assets
$
573,557
$
494,446
$
416,200
Liabilities and Equity
Accounts payable
$
141,388
$
82,726
$
54,389
Long-term notes payable secured by
mortgages on plant assets
106,750
112,585
91,060
Common stock,...
Simon Company’s year-end balance sheets follow. At December 31 Current Yr 1 Yr Ago 2 Yrs...
Simon Company’s year-end balance sheets follow.
At December 31
Current Yr
1 Yr Ago
2 Yrs Ago
Assets
Cash
$
33,341
$
37,062
$
40,584
Accounts receivable, net
93,789
68,870
53,587
Merchandise inventory
119,113
90,123
55,951
Prepaid expenses
10,737
9,929
4,466
Plant assets, net
297,036
271,616
243,412
Total assets
$
554,016
$
477,600
$
398,000
Liabilities and Equity
Accounts payable
$
137,950
$
83,136
$
51,485
Long-term notes payable secured by
mortgages on plant assets
104,155
107,651
87,078
Common stock,...
Simon Company’s year-end balance sheets follow. At December 31 Current Yr 1 Yr Ago 2 Yrs...
Simon Company’s year-end balance sheets follow.
At December 31
Current Yr
1 Yr Ago
2 Yrs Ago
Assets
Cash
$
29,554
$
34,899
$
37,080
Accounts receivable, net
87,405
62,306
48,470
Merchandise inventory
113,192
83,964
53,185
Prepaid expenses
9,420
9,439
3,958
Plant assets, net
271,571
250,032
224,507
Total assets
$
511,142
$
440,640
$
367,200
Liabilities and Equity
Accounts payable
$
131,093
$
75,213
$
49,440
Long-term notes payable secured by
mortgages on plant assets
96,095
104,388
80,340
Common stock,...
Simon Company’s year-end balance sheets follow. At December 31 Current Yr 1 Yr Ago 2 Yrs...
Simon Company’s year-end balance sheets follow.
At December 31
Current Yr
1 Yr Ago
2 Yrs Ago
Assets
Cash
$
33,469
$
39,122
$
41,164
Accounts receivable, net
97,984
71,230
54,337
Merchandise inventory
119,500
92,298
60,815
Prepaid expenses
11,214
10,270
4,437
Plant assets, net
310,838
281,050
255,047
Total assets
$
573,005
$
493,970
$
415,800
Liabilities and Equity
Accounts payable
$
138,398
$
85,151
$
56,532
Long-term notes payable secured by
mortgages on plant assets
106,648
115,885
89,135
Common stock,...
Simon Company’s year-end balance sheets follow. At December 31 Current Yr 1 Yr Ago 2 Yrs...
Simon Company’s year-end balance sheets follow.
At December 31
Current Yr
1 Yr Ago
2 Yrs Ago
Assets
Cash
$
35,940
$
42,011
$
43,761
Accounts receivable, net
89,000
62,600
51,100
Merchandise inventory
110,000
83,500
57,000
Prepaid expenses
11,574
11,028
4,862
Plant assets, net
368,799
331,303
289,777
Total assets
$
615,313
$
530,442
$
446,500
Liabilities and Equity
Accounts payable
$
151,681
$
88,748
$
58,349
Long-term notes payable secured by
mortgages on plant assets
114,522
120,782
97,690
Common stock,...
Simon Company's year-end balance sheets follow. At December 31 Current Yr 1 Yr Ago 2 Yrs...
Simon Company's year-end balance sheets follow.
At December 31
Current Yr
1 Yr Ago
2 Yrs Ago
Assets
Cash
$
35,149
$
41,501
$
43,226
Accounts receivable, net
102,901
72,626
57,634
Merchandise inventory
126,791
93,091
60,159
Prepaid expenses
11,548
10,894
4,755
Plant assets, net
325,373
300,648
266,526
Total assets
$
601,762
$
518,760
$
432,300
Liabilities and Equity
Accounts payable
$
148,340
$
86,794
$
55,922
Long-term notes payable secured by
mortgages on plant assets
113,131
122,894
97,449
Common stock,...
ADVERTISEMENT
ADVERTISEMENT
Latest Questions
- Question 3 (a) What do you understand by a time series forecasting approach? Describe each of...
- 1 Which of the following overflow values clips all content that extends beyond the containing element’s...
- What are the key environmental and biological controls over decomposition rate in ecosystems?
- describe why independent oversight is important to taxpayers.
- Graph a Monopoly. Compare the price, quantity, and ATC of a monopoly with a perfectly competitive...
- Problem 18-12 Various shareholders' equity topics; comprehensive [LO18-1, 18-4, 18-5, 18-6, 18-7, 18-8] Part A In...
- Hello There, This is discussion Question For Advanced Database Systems Question: (a) Please define what a...
ADVERTISEMENT