Question
In: Operations Management
A process considered to be in control measures an ingredient in ounces. A quality inspector took...
A process considered to be in control measures an ingredient in ounces. A quality inspector took 10 samples, each with 5 observations as follows:
|
Samples |
Observations |
||||
|
1 |
2 |
3 |
4 |
5 |
|
|
1 |
10 |
9 |
10 |
9 |
12 |
|
2 |
9 |
9 |
11 |
11 |
10 |
|
3 |
13 |
9 |
10 |
10 |
9 |
|
4 |
10 |
10 |
11 |
10 |
10 |
|
5 |
12 |
10 |
9 |
11 |
10 |
|
6 |
10 |
10 |
8 |
12 |
9 |
|
7 |
10 |
11 |
10 |
8 |
9 |
|
8 |
13 |
10 |
8 |
10 |
8 |
|
9 |
8 |
8 |
12 |
12 |
9 |
|
10 |
10 |
12 |
9 |
8 |
12 |
a) Using this information, obtain three-sigma (i.e., z=3) control limits for a mean control chart and control limits for a range chart, respectively. It is known from previous experience that the standard deviation of the process is 1.36.
b) Discuss whether the process is in control or not.
Solutions
Expert Solution
a)
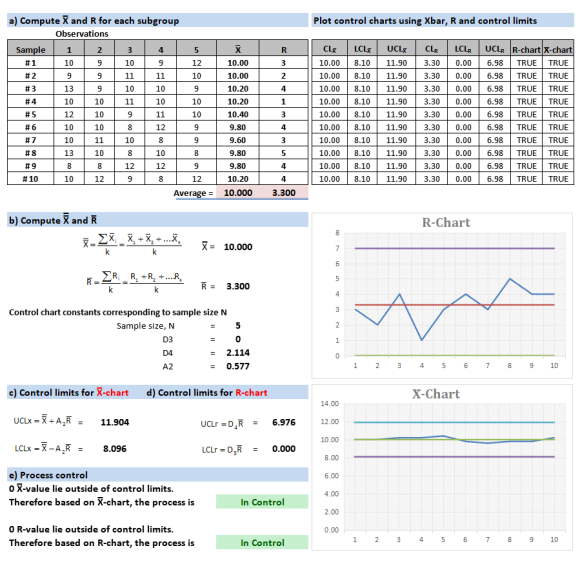
b) The process is in control
a) Compute X and R for each subgroup Plot control charts using Xbar, R and control limits Observations Sample #1 #2 #3 #4 #5 #6 #7 #8 #9 #10 10 10 13 10 12 10 10 13 12.00 10.00 9.00 10.00 10.00 9.00 9.00 8.00 9.00 12.00 9.80 7.54 12.06 3.10 0.00 7.07 TRUETRUE 9.80 7.54 12.06 3.10 0.00 7.07 TRUETRUE 9.80 7.54 12.06 3.10 0.00 7.07 TRUETRUE 9.80 7.54 12.06 3.10 0.00 7.07 TRUETRUE 9.80 7.54 12.06 3.10 0.00 7.07 TRUETRUE 9.80 7.54 12.06 3.10 0.00 7.07 TRUETRUE 9.80 7.54 12.06 3.10 0.00 7.07 TRUETRUE 9.80 7.54 12.06 3.10 0.00 7.07 TRUETRUE 9.80 7.54 12.06 3.10 0.00 7.07 TRUETRUE 9.80 7.54 12.06 3.10 0.00 7.07 TRUETRUE 10 10 10 10 10 10 3 10 3 10 10 10 12 Average9.800 3.100 b) Compute X and R R-Chart 9.800 R3.100 Control chart constants corresponding to sample size N Sample size, N D4 2.282 0.729 1 2 345 6 7 8910 c) Control limits for X-chart d) Control limits for R-chart X-Chart 14.00 7.07412.00 10.00 8.00 6.00 4.00 2.00 0.00 UCLr D4R 12.060 LCLr DR - 7.540 - 0.000 e) Process control 0 X-value lie outside of control limits. Therefore based on X-chart, the process is In Control 0 R-value lie outside of control limits. 1 2 345 6 7 8 910 Therefore based on R-chart, the process is In Control
 keosha answered 2 years ago
Related Solutions
A production process is checked periodically by a quality control inspector. The inspector selects simple random...
The quality-control inspector of a production plant will reject a batch of syringes if two or...
An inspector is doing a quality control assessment on a new shipment of wireless headphones. The...
x bar and R control Charts A quality control inspector at the Company B has taken...
A quality control inspector is interested in maintaining a flatness specification for the surface of the metal disks.
20% of all CDs manufactured by an electronics company are defective. A quality control inspector randomly...
4/ A quality control inspector has determined that 0.25% of all parts manufactured by a particular...
A quality inspector is worrying about the defective produced in the production process. He wants to...
1a) As Quality Control Inspector, you have previously believed a claim that 3.2% of items made...
Question 1 options: As Quality Control Inspector, you have previously believed a claim that 3.2% of...
- in your own opinion, It has been said that a smartphone is a computer in your...
- Use the internet to read more about journaling file systems such as NTFS, extfs2, and extfs3....
- Consider the quick sort algorithm. The quick sort algorithm is a divide and conquer approach which...
- Tesla 1. How to make these weaknesses into strengths? Burn through cash, high prices, bottlenecking/product delays,...
- Assignment # 12: Email Presentation Learning Objectives and Outcomes Design a PowerPoint presentation appropriate for middle...
- Identify which of the perspectives you believe is the BEST for accurately explaining human behavior and...
- What trade policies should a country adopt? why? Explain. Also, find some reference materials on this...