Question
In: Statistics and Probability
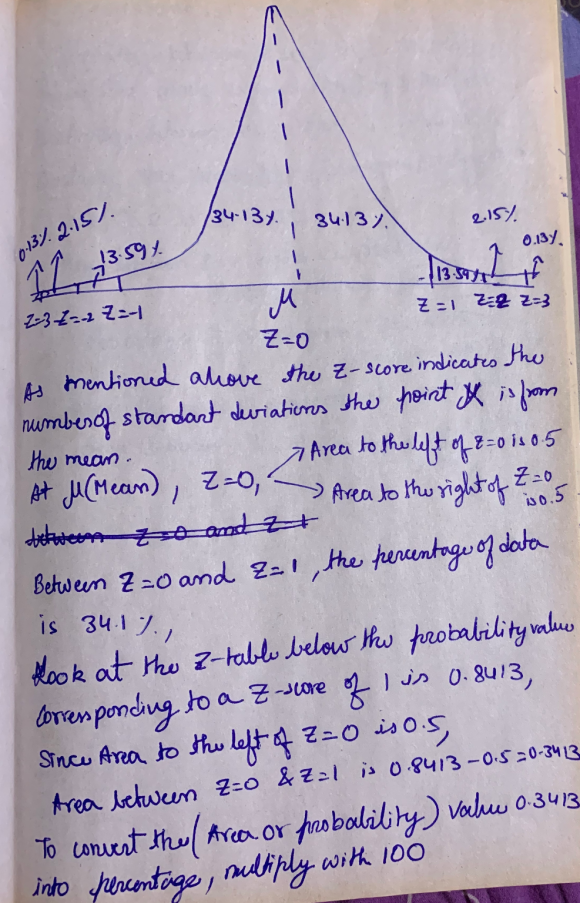
Draw the standard normal curve with the percentages of data fall within each standard deviation.
Draw the standard normal curve with the percentages of data fall within each standard deviation.
Solutions


 orchestra answered 4 years ago
Related Solutions
Positive behaviors on the normal curve has a mean of 12 and a standard deviation of...
Positive behaviors on the normal curve has a mean of 12 and a
standard deviation of 3, what are the
z-scores and
percentiles for the following
outcomes?
15 positive behaviors
18 positive behaviors
21 positive behaviors
9 positive behaviors
6 positive behaviors
3 positive behaviors
12 positive behaviors
Draw 100 numbers from a normal distribution with a mean of **7** and standard deviation of...
Draw 100 numbers from a normal distribution with a mean of **7**
and standard deviation of **4**, and store the output in an object
called "x1":
(R STUDIO)
Can you show how to draw the normal curve for each of the problems and label...
Can you show how to draw the normal curve for each of the
problems and label it as well?
Heights of MEN in the U.S. are normally distributed µ =
69.6 inches with σ = 3 inches.
-________ percent (to nearest %) of men in the U.S. are either
shorter than 5 ft. or taller than 6 ft?
-In a group of 150 U.S. men, approximately ________ of them
should be shorter than 65 inches.
-A male height of _______________...
for certain rainfall data, the standard deviation Sx = 3.4 mm. If the Normal distribution was...
for certain rainfall data, the standard deviation Sx = 3.4 mm.
If the Normal distribution was used and the 10 year rain x10 = 34.1
mm, then the 2 year rain x2 is:
6.82 mm
29.74 mm
31.72 mm
38.18 mm
For each question draw the normal curve and shade the area where applicable Do not give...
For each question draw the normal curve and shade the area where
applicable
Do not give calculator key strokes. ( Give the formula used
)
Circle your answer to each question.
3. The daily salaries of substitute teachers for eight local
school district is given:
60, 56, 60, 55, 70, 55, 60, 55.
What is the point estimate of the population mean μ.
(Sample Mean)
Find the 90% confidence interval for the mean salaries of
substitute teachers in the...
Every Normal model is defined by its parameters, the mean and the standard deviation. For each...
Every Normal model is defined by its parameters, the
mean and the standard deviation. For each model described here,
find the missing parameter. As always, start by drawing a
picture.
μ=20, 45% above 30, σ= ?
μ=88, 2% below 50, σ= ?
σ=5, 80% below 100, μ=?
σ=15.6, 10% above 17.2, μ=?
Blind Spot Lab: What percent of the mean is the standard deviation? - The percentages were...
Blind Spot Lab: What percent of the mean is the standard
deviation?
- The percentages were 73% and 90%. What does this mean in
reference to variability?
I want to calculate the max, min, mean, standard deviation and the percentage of data within...
I want to calculate the max, min, mean, standard deviation and the percentage of data within one standard deviation from a file already existing in my directory using JAVA. As you can see it below, I have found max, min, mean and stand deviation. How can I get the percentages of data within one standard deviation in the following code?
import java.io.*;
import java.util.Scanner;
public class DataFile {
public static void main(String[] args) {
// declare variables
double number, maximum,...
What is the standard deviation of the standard normal distribution? What is the mean of the...
What is the standard deviation of the standard normal
distribution?
What is the mean of the standard normal distribution?
All symmetric distributions are normal distributions. True or
false?
Assume body temperature scores are normally distributed in the
population with a mean of 36.81°C and a standard deviation of
0.41°C. A person's body temperature is 37.33°C. Calculate their
z-score. (Round answer to 2 decimal places)
Calculate the z-score for a person who has a body temperature of
35.72°C. (Round answer to...
ADVERTISEMENT
ADVERTISEMENT
Latest Questions
- A skier of mass 60 kg starts at the top of a steep slope with an...
- If banks must hold $4 in reserves for each $10 in deposits, and the public decides...
- A 244 g mass is hung on a spring. As a result the spring stretches 20.5...
- I'm trying to Generate number every 3 seconds and update the currenet number.I'm able to generate...
- a sulfide of iron, containing 36.5% S by mass, is heated in O2(g), and the products...
- Python previous function: wrtie a function that takes one argument. The function returns True if the...
- A professional couple wishes to purchase a new home costing $750,000, make a 20 percent down...
ADVERTISEMENT