Question
In: Statistics and Probability
The data below are the final exam scores of 10 randomly selected calculus students and the...
The data below are the final exam scores of 10 randomly selected calculus students and the number of hours they slept the night before the exam:
| Hours Slept (x) | 7 | 11 | 6 | 13 | 7 | 8 | 8 | 11 | 12 | 9 |
|---|---|---|---|---|---|---|---|---|---|---|
| Exam Scores (y) | 68 | 83 | 63 | 91 | 69 | 81 | 88 | 93 | 93 | 74 |
Using the equation of the regression line, with all numbers in it rounded to 2 decimal places, predict the final exam score of a student who slept for 3 hours the night before the exam. (Round the score to 2 decimal places)
Select one:
49.83
45.64
55.97
50.22
59.58
61.01
Solutions
Expert Solution
Solution:
n = 10
| X | Y | XY | X^2 | Y^2 | |
| 7 | 68 | 476 | 49 | 4624 | |
| 11 | 83 | 913 | 121 | 6889 | |
| 6 | 63 | 378 | 36 | 3969 | |
| 13 | 91 | 1183 | 169 | 8281 | |
| 7 | 69 | 483 | 49 | 4761 | |
| 8 | 81 | 648 | 64 | 6561 | |
| 8 | 88 | 704 | 64 | 7744 | |
| 11 | 93 | 1023 | 121 | 8649 | |
| 12 | 93 | 1116 | 144 | 8649 | |
| 9 | 74 | 666 | 81 | 5476 | |
| SUM | 92 | 803 | 7590 | 898 | 65603 |
Slope of the regression line is
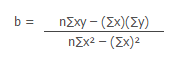
b = 3.92
Now , y intercept of the line is
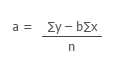
a = 44.21
The equation of the regression line is
= a + bx
i.e.
= 44.21 + (3.92)x
For x = 3, find the predicted value of y .
Put x = 3 in the regression line equation.
= 44.21 + (3.92 * 3) = 55.97
Answer : 55.97
 orchestra answered 3 years ago
Related Solutions
The data below are the final exam scores of 5 randomly selected calculus students and the...
The scores 30 students earned on the Calculus I final exam are listed in the data...
An investigator collected data on midterm exam scores and final exam scores of elementary school students;...
28 randomly selected students took the calculus final. If the sample mean was 87 and the...
Thirty randomly selected students took the calculus final. If the sample mean was 75 and the...
Below are the final exam scores of 20 Introductory Statistics students.
Thirty randomly selected students took the calculus final. If the sample mean score was 79 and...
A sample of 10 students record their scores on the final exam for their statistics class....
The paired data below consist of the test scores of 6 randomly selected students and the...
The data below are scores of 8 randomly selected statistic students, and the number of hours...
- Identify which of the perspectives you believe is the BEST for accurately explaining human behavior and...
- What trade policies should a country adopt? why? Explain. Also, find some reference materials on this...
- In Java: Suppose you want to implement a Sudoku game that consists of 9x9 rows and...
- What is the percent yield of the solid product when 17.62 g of iron(III) nitrate reacts...
- Kilgore Natural Gas has $1,000 par value bonds outstanding at 12% interest. The bonds will mature...
- 19.20 grams of barium hydroxide, Ba(OH)2 is dissolved in 178.0 ml of water (you may assume...
- An LC circuit like that in the figure below consists of a 3.40-H inductor and an...