Question
In: Statistics and Probability
For the following data, find the regression equation for predicting Y from X X Y 1...
For the following data, find the regression equation for predicting Y from X
|
X |
Y |
|
1 |
2 |
|
4 |
7 |
|
3 |
5 |
|
2 |
1 |
|
5 |
8 |
|
3 |
7 |
1a.
Group of answer choices
a. Ŷ = -2X + 8
b. Ŷ =2X + 8
c. Ŷ =1.8X - 0.4
d. Ŷ =1.8X + 0.4
1b.
For the following scores, find the regression equation for predicting Y from X
|
X |
Y |
|
3 |
8 |
|
6 |
4 |
|
3 |
5 |
|
3 |
5 |
|
5 |
3 |
Solutions
Expert Solution
Solution:
1a)
Here , n = 6
| X | Y | XY | X^2 | Y^2 | |
| 1 | 2 | 2 | 1 | 4 | |
| 4 | 7 | 28 | 16 | 49 | |
| 3 | 5 | 15 | 9 | 25 | |
| 2 | 1 | 2 | 4 | 1 | |
| 5 | 8 | 40 | 25 | 64 | |
| 3 | 7 | 21 | 9 | 49 | |
| Sum | 18 | 30 | 108 | 64 | 192 |
Now ,
Slope of the regression line is
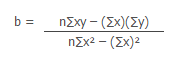
b = 1.8
Now , y intercept of the line is
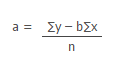
a = -0.4
The equation of the regression line is
= bx + a
= 1.8X - 0.4
1b)
Here n = 5
| X | Y | XY | X^2 | Y^2 | |
| 3 | 8 | 24 | 9 | 64 | |
| 6 | 4 | 24 | 36 | 16 | |
| 3 | 5 | 15 | 9 | 25 | |
| 3 | 5 | 15 | 9 | 25 | |
| 5 | 3 | 15 | 25 | 9 | |
| Sum | 20 | 25 | 93 | 88 | 139 |
Now ,
Slope of the regression line is
b = -0.875
Now , y intercept of the line is
a = 8.5
The equation of the regression line is
= bX + a
= -0.875X + 8.5
 orchestra answered 3 years ago
Related Solutions
For the following data: Find the regression equation for predicting Y from X (Provide your work)....
For the following data:
Find the regression equation for predicting Y from
X (Provide your work).
Use the regression equation to find a predicted Y for
each X.
Find the difference between the actual Y value and the
predicted Y value for each
individual, square the differences, and add
the squared values to obtain SSresidual.
Calculate the Pearson correlation for these data. Use
r2 and SSy to compute SSresidual. You should
obtain the same value as in part c.
Now...
D. Find a linear (regression) equation with following data. x y 70 25 65 20 60 ...
D. Find a linear (regression)
equation with following data.
x y
70 25
65 20
60 30
50 35
45 40
Ans.: y = ( ) + ( ) * x.
Show your work.
Find the regression equation using the following set of data with y as the response variable....
Find the regression equation using the following set of data
with y as the response variable.
x
y
40.2
82.2
54.2
111.8
43
84.3
30.7
68.5
33
90.8
42.8
78.5
30.9
71.7
28.6
69.8
36.6
83.1
41.1
93.9
26.6
63.9
45.5
95.5
What is the correlation coefficient? use three decimal
places.
r =
What is the regression line equation. Use each value to three
decimal places.
ˆyy^ = + x
What is the predicted value of the response variable, when using a...
Determine the regression equation (write the regression equation) of the following data, where Y is the...
Determine the regression equation (write the regression
equation) of the following data, where Y is the dependant variable
and X is the predictor:
X
Y
5
85
4
103
6
70
5
82
5
89
5
98
6
66
6
95
2
169
7
70
7
48
b) Interpret the regression coefficients.
c) Graph the regression line.
d) Use the regression equation to predict Y for
X=3.
e) Compute the coefficient of
determination.
f) Interpret the coefficient of
determination.
g)...
9) Use the following data to estimate a linear regression equation between y and x. Interpret...
9) Use the following data to estimate a linear regression
equation between y and x. Interpret the estimated slope
coefficient. Predict y for an x value of 9. Calculate and interpret
the model’s R-squared.
x
y
21
12
17
10
11
8
3
5
13
15
a. Develop an estimated regression equation for the data of the form y-hat = bo + b1 x.
Consider the following data for two variables, X and Y
X
6
29
21
15
24
Y
10
30
22
14
25
a. Develop an estimated regression equation for the data of the form y-hat = bo + b1 x. Comment on the adequacy of this equation for predicting y . Enter negative value as negative number.
The regression equation is
Y = [ ] + [ ] X (to 2 decimals)
S = [ ] (to 3 decimals)...
1- The regression of X on Y is not the same as the regression of Y...
1-
The regression of X on Y is not the same as the regression of Y
on X. Why is this?
Select one:
a. Because the regression minimises the residuals of y, not the
residuals of x.
b. Because unlike correlation, regression assumes X causes
Y.
c. Because one goes through (mean x, mean y) whereas the other
goes through (mean y, mean x).
d. Because the F test divides MSy by MSx, not the other way
round.
2-
Using...
Find the regression equation for the following data set x 143 167 143 189 175 174...
Find the regression equation for the following data set
x 143 167 143 189
175 174 134 155
y
20
80
72
69
44
59
51 63
-0.33x + 5.23
0.33x – 5.23
0.33x + 5.23
cannot be determined
The estimated regression equation for predicting the number of speeding tickets from a driver’s age is...
The estimated regression equation for predicting the number of
speeding tickets from a driver’s age is given as Y = 5 – 0.06X. For
every year older an individual gets, the estimated number of
speeding tickets
Need to know which is the answer:
Increases by 5 tickets
Decreases by 5 tickets
Decreases by 0.06 tickets
The linear regression equation for predicting poverty (%) from the high school graduation rate (%) is...
The linear regression equation for predicting poverty (%) from
the high school graduation rate (%) is as follows: ˆ y = 29 -0.2*x
High school graduation rate for North Carolina is 22% and the
poverty rate is 29.5%. Find the residual for this observation
(round your answer to one decimal place)
ADVERTISEMENT
ADVERTISEMENT
Latest Questions
- A professional couple wishes to purchase a new home costing $750,000, make a 20 percent down...
- Padre holds 100 percent of the outstanding shares of Sonora. On January 1, 2016, Padre transferred...
- Question: Use backtracking algorithm design to write Java code to solve the subset problem: given a...
- Patsy Ltd. produces ice-cream and would like to accurately forecast sales so that it can meet...
- Power Music owns five music stores, where it sells music, instruments, and supplies. In addition, it...
- 4) A client wants to finance the purchase of a house costing $50,000 over a period...
- [The following information applies to the questions displayed below.] In 2018, Sheryl is claimed as a...
ADVERTISEMENT