Question
In: Statistics and Probability
A random sample of 49 children with working mothers showed that they were absent from school...
-
A random sample of 49 children with working mothers showed that they were absent from school an average of 6 days per term with a standard deviation of 1.8 days.
-
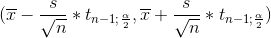
Write down the equation you should use to construct the confidence interval for the average number of days absent per term for all the children.
-
Determine a 98% confidence interval estimate for the average number of days absent per term for all the children.
-
Determine a 95% confidence interval estimate for the average number of days absent per term for all the children.
-
Discuss why 98% and 95% confidence intervals are different.
Solutions
Expert Solution
ANSWER::
Let µ denote the average number of days absent per term for all the children
According to data the sample mean x̅ = 6, sample standard deviation s = 1.8 and sample size n = 49
Let the level of significance be α
Solution to a)
The equation is

Solution to b)
Here α = 2% = 0.02

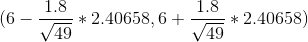
So 98% Confidence Interval is

= (5.381165, 6.618835)
Hence 98% Confidence Interval for µ is (5.381165, 6.618835)
Solution to c)
Here α = 5% = 0.05

So 95% Confidence Interval is

= (5.48298, 6.51702)
Solution to d)
A 95% confidence interval is a range of values that you can be 95% certain contains the true mean of the population.
A 98% confidence interval is a range of values that you can be 98% certain contains the true mean of the population.
So that is why both are different and mathematically as the critical value for both differ so both are different.
(OR) TRY THIS ANSWER
Given Information


- A) Since the population standard deviation is
not known, the
 % Confidence Interval is given by
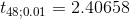
B) The 98% Confidence Interval is given by

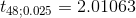
C) The 95% Confidence Interval is given by

- D) As we increase the confidence of claiming the interval, the interval increases. This is quite obvious, as to be more confident of something, we have to relax the boundaries, to accept more values. Hence, with increase of confidence level, the confidence interval relaxes it's boundaries.
 % Confidence Interval is given by


NOTE:: I HOPE YOUR HAPPY WITH MY ANSWER....***PLEASE SUPPORT ME WITH YOUR RATING...
***PLEASE GIVE ME "LIKE"...ITS VERY IMPORTANT FOR ME NOW....PLEASE SUPPORT ME ....THANK YOU
 orchestra answered 3 years ago
Related Solutions
A random sample of 49 children with working mothers showed that they were absent from school...
A random sample of 49 children with working mothers showed that they were absent from school...
A random sample of elementary school children in New York state is to be selected to...
G. A sample of 9 mothers was taken. The mothers were asked the age of their...
A random sample size of 1000 school children from urban areas shows average height is 150cm...
A random sample of 100 Ohio businesses showed that 34 were owned by women. A sample...
A random sample of 200 high school students in a particular town showed that 122 smoke...
A random sample of 75 pre-school children was taken. The child was asked to draw a...
Consider the number of days absent from a random sample of six students during a semester:...
A random sample of 49 measurements from one population had a sample mean of 10, with...
- How do I make this sort in true alphabetical order instead of ascii(ABCabc) order? I am...
- As a healthcare provider in physical therapy, athletic training, or as an exercise scientist and personal...
- in the market for makeup artists, what happens after the invention of high-definition tv allowing viewers...
- 10. What are the three monetary policy tools of the Fed? Briefly describe how each tool...
- In what ways would the role of a manager working in a nonstandard international assignment arrangement...
- Write a Bash script called move that could replace the UNIX command mv. 'move' tries to...
- Write program in C language using Pthreads API to simulate the real problem, the Sleeping Teaching...