Question
In: Advanced Math
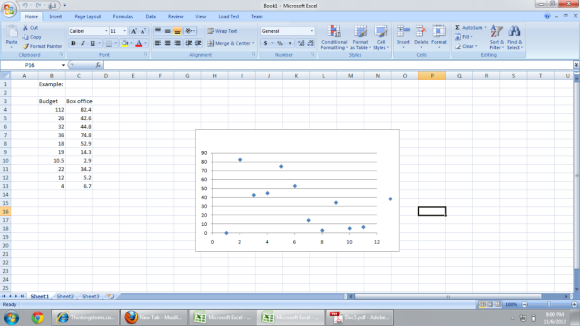
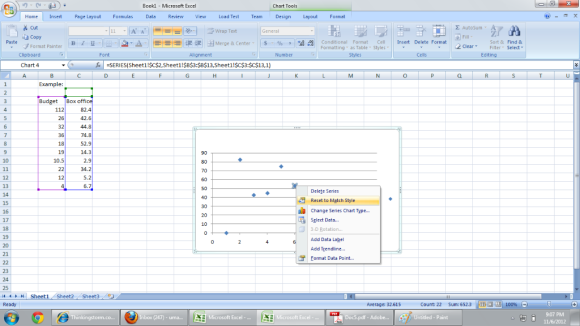
using linear curve fit. Display equation and R-square value on graph chart. Use an example to...
using linear curve fit. Display equation and R-square value on graph chart.
Use an example to show how to find this on google docs
Solutions


 Colby Messinger answered 3 years ago
Related Solutions
sketch the curve with the given polar equation by first sketching the graph of r as...
sketch the curve with the given polar equation by first
sketching the graph of r as a function of theta in Cartesian
coordinates.
1) r = 3cos(3theta)
2) r = 1 + 3cos(theta)
3) r = sin (theta / 2)
Please solve this problem with a detailed explanation, not just
a answer.
Sketch the curve with the given polar equation by first sketching the graph of r as...
Sketch the curve with the given polar equation by first
sketching the graph of r as a function of θ in Cartesian
coordinates.
r = 3 cos(2θ)
1. a) On an AD/AS graph, use a Keynesian supply curve to display the impact of...
1.
a) On an AD/AS graph, use a Keynesian supply curve to display
the impact
of stimulus spending.
b) On an AD/AS graph, use a Classical supply curve to display the
impact
of stimulus spending.
Using the chart below, create a graph that would be appropriate to display age range statistics....
Using the chart below, create a graph that would be appropriate
to display age range statistics. First row (1,2,3,4,5) is the
header row and should not be included in your graph.
1
2
3
4
5
42
52
16
13
3
51
18
17
54
4
62
91
25
21
6
10
85
6
68
9
Instructions: Using the numbers in the above chart, select the
appropriate graphic representation to use if the data represented
age. Using your graph what...
a. Using the following R codes to fit the linear regression model for VitC on HeadWt,...
a. Using the following R codes to fit the linear regression
model for VitC on HeadWt, and obtain its summary. Paste the R
output in your homework. cabbages_data <-
read.csv("http://users.stat.umn.edu/~wuxxx725/data/cabbages_data.csv")
cabbages_reg <- lm(VitC ~ HeadWt, data = cabbages_data)
summary(cabbages_reg)
b. State and interpret the value of r 2 from the model summary
output in part a).
c. Calculate the correlation r between HeadWt and VitC, and
state the strength and the direction of the correlation.
d. State the estimated regression...
Using the following R codes to fit the linear regression model for VitC on HeadWt, and...
Using the following R codes to fit the linear regression model
for VitC on HeadWt, and obtain its summary. Paste the R output in
your homework. cabbages_data <-
read.csv("http://users.stat.umn.edu/~wuxxx725/data/cabbages_data.csv")
cabbages_reg <- lm(VitC ~ HeadWt, data = cabbages_data)
summary(cabbages_reg)
a. Using the following R codes to fit the linear regression model for VitC on HeadWt,...
a. Using the following R codes to fit the linear regression
model for VitC on HeadWt, and obtain its summary. Paste the R
output in your homework. cabbages_data <-
read.csv("http://users.stat.umn.edu/~wuxxx725/data/cabbages_data.csv")
cabbages_reg <- lm(VitC ~ HeadWt, data = cabbages_data)
summary(cabbages_reg) b. State and interpret the value of r 2 from
the model summary output in part a). c. Calculate the correlation r
between HeadWt and VitC, and state the strength and the direction
of the correlation. d. State the estimated regression...
linear quadratic curve fit yielded a value of beta < 0. explain under what circumstances this...
linear quadratic curve fit yielded a value of beta
< 0. explain under what circumstances this may be possible?
Determine the Best Fit Linear Regression Equation Using Technology - Excel Question The table shows the...
Determine the Best Fit Linear Regression Equation Using
Technology - Excel
Question
The table shows the age in years and the number of hours slept
per day by 24 infants who were less than 1 year old. Use Excel to
find the best fit linear regression equation, where age is the
explanatory variable. Round the slope and intercept to one decimal
place.
Age
Hours
0.03
16.5
0.05
15.2
0.06
16.2
0.08
15.0
0.11
16.0
0.19
16.0
0.21
15.0
0.26
14.5...
Q5. Report the slope and uncertainty in the slope of the linear fit on your graph,...
Q5. Report the slope and uncertainty in the slope of the linear
fit on your graph, include the correct units. Q6. Use your reported
slope from the graph to calculate the spring constant k, and
include the correct units. Show all work. Q7. Using propagation of
uncertainties, it can be shown that the uncertainty in the spring
constant k may be calculated using Using your graph for the
uncertainty in the slope, along with your answer to Q6, calculate
the...
ADVERTISEMENT
ADVERTISEMENT
Latest Questions
- If banks must hold $4 in reserves for each $10 in deposits, and the public decides...
- A 244 g mass is hung on a spring. As a result the spring stretches 20.5...
- I'm trying to Generate number every 3 seconds and update the currenet number.I'm able to generate...
- a sulfide of iron, containing 36.5% S by mass, is heated in O2(g), and the products...
- Python previous function: wrtie a function that takes one argument. The function returns True if the...
- A professional couple wishes to purchase a new home costing $750,000, make a 20 percent down...
- Padre holds 100 percent of the outstanding shares of Sonora. On January 1, 2016, Padre transferred...
ADVERTISEMENT