Question
In: Math
Your company has been testing two flavors of coffee using free samples, let's call them Flavor...
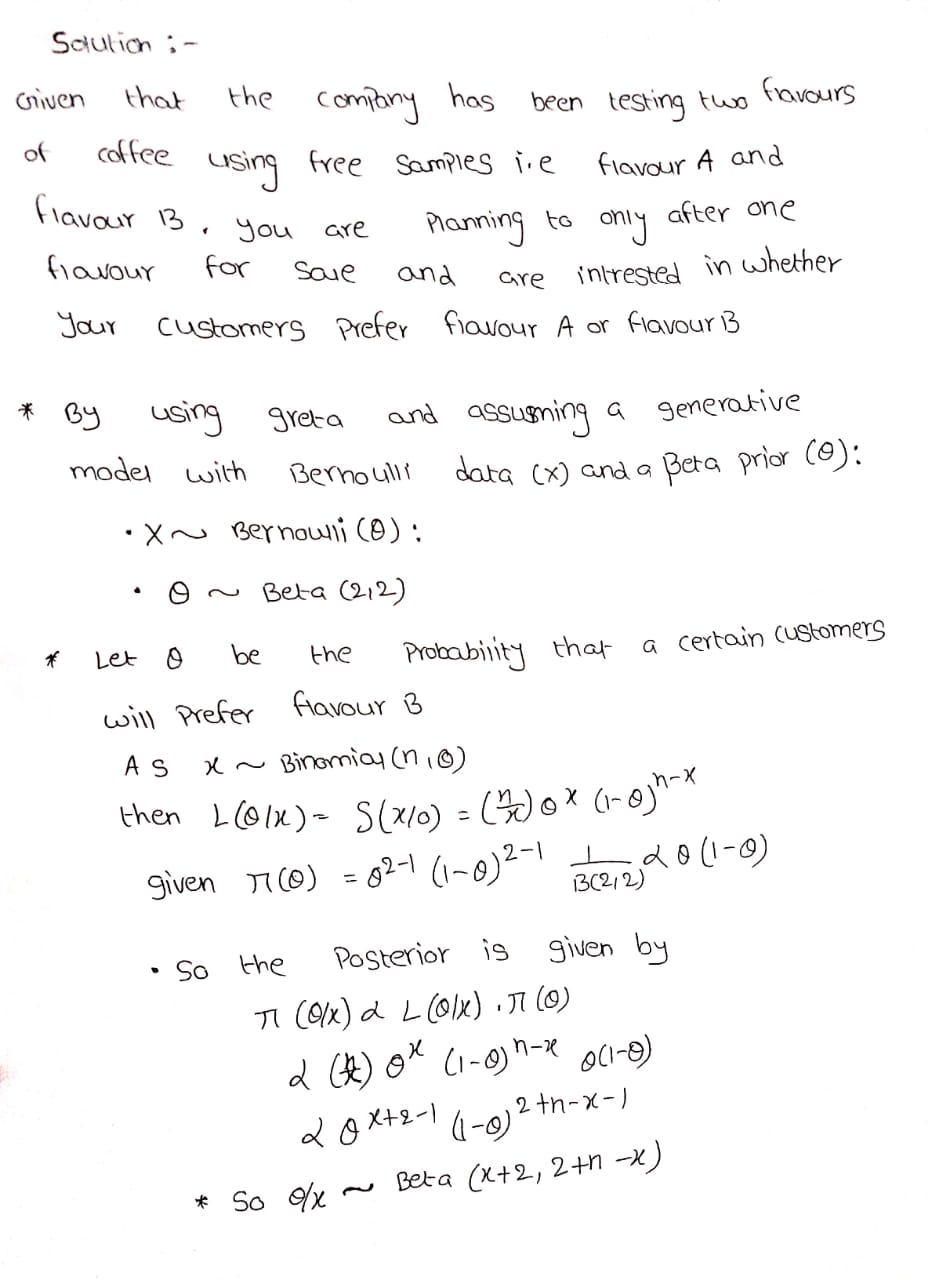
Your company has been testing two flavors of coffee using free samples, let's call them Flavor A and Flavor B. You are planning to only offer one flavor for sale and are interested in whether your customers prefer Flavor A or Flavor B.
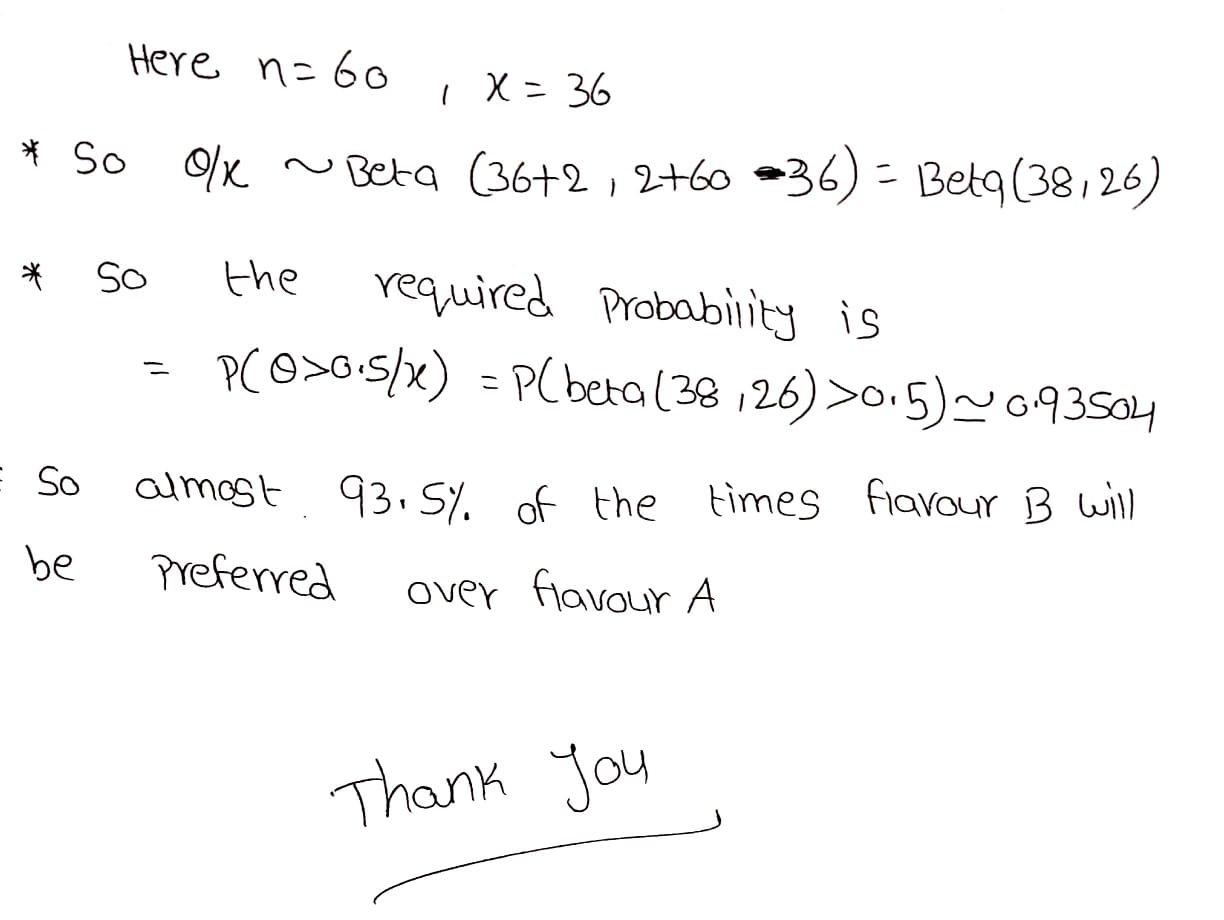
You use a taste testing survey of 60 randomly selected people, and find that 36 people prefer Flavor B.
Using greta and assuming a generative model with Bernoulli data (X) and a Beta prior (θ):
X∼Bernoulli(θ)
Θ∼Beta(2,2)
determine what your updated probability is that Flavor B is preferred to Flavor A. In other words, what percentage of your posterior draws have a theta that is above 0.5?
(Enter answer as a decimal - i.e. 12% would be entered as 0.120. Round to the nearest thousandths place)
Please show me how something like this would be solved using R.
Solutions
 milcah answered 1 month ago
Related Solutions
A geneticist is studying the inheritance of two traits, let's just call them G and H....
You work for a bubble gum company testing new flavors to bring to market. Your marketing...
1. A taste-testing experiment has been designed so that four brands of Colombian coffee are to...
Hypothesis Testing (Two samples – means) Using the 5 step process: After four weeks in the...
You’ve been examining two enzymes (let’s call them Enzyme A and Enzyme B) . For enzyme...
12. An agricultural research company has developed two new types of soy bean seeds, call them...
A testing laboratory has been hired by a company called “Drug Company Q” to analyze a...
Two sound waves (call them X and Y) travel through the air. Wave X has a...
This summer, you receive a call at work that your teen has been arrested for shoplifting,...
ONLY E AND F PLEASE Sharp Discounts Wholesale Club has two service desks (call them A...
- in the market for makeup artists, what happens after the invention of high-definition tv allowing viewers...
- 10. What are the three monetary policy tools of the Fed? Briefly describe how each tool...
- In what ways would the role of a manager working in a nonstandard international assignment arrangement...
- Write a Bash script called move that could replace the UNIX command mv. 'move' tries to...
- Write program in C language using Pthreads API to simulate the real problem, the Sleeping Teaching...
- HF(g) + H2O(l) = H3O+(aq) + F-(aq) In the following equilibrium in a closed system, indicate...
- : Write a paragraph to reflect on what you have learned about Microsoft access in terms...