Question
In: Physics
• Draw a diagram including your chosen coordinate system. • Label all quantities in the diagram...
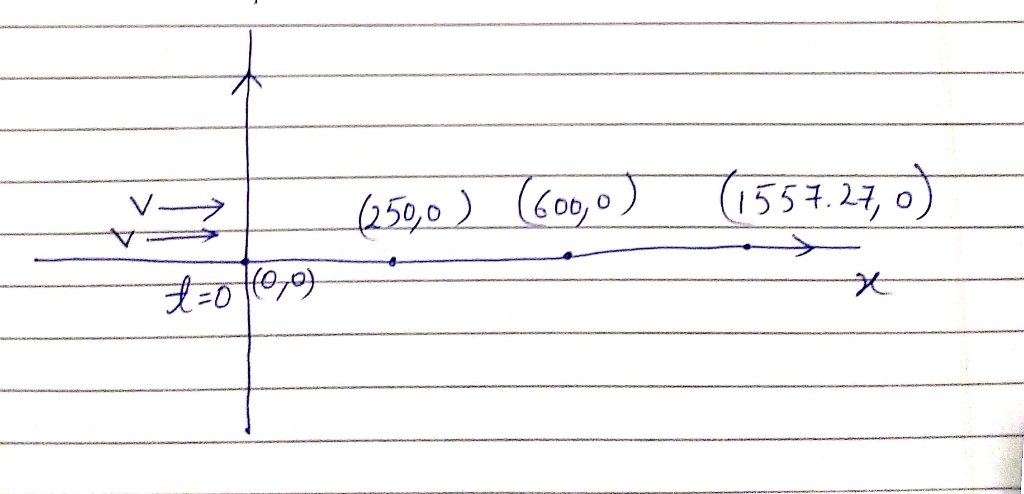
• Draw a diagram including your chosen coordinate system.
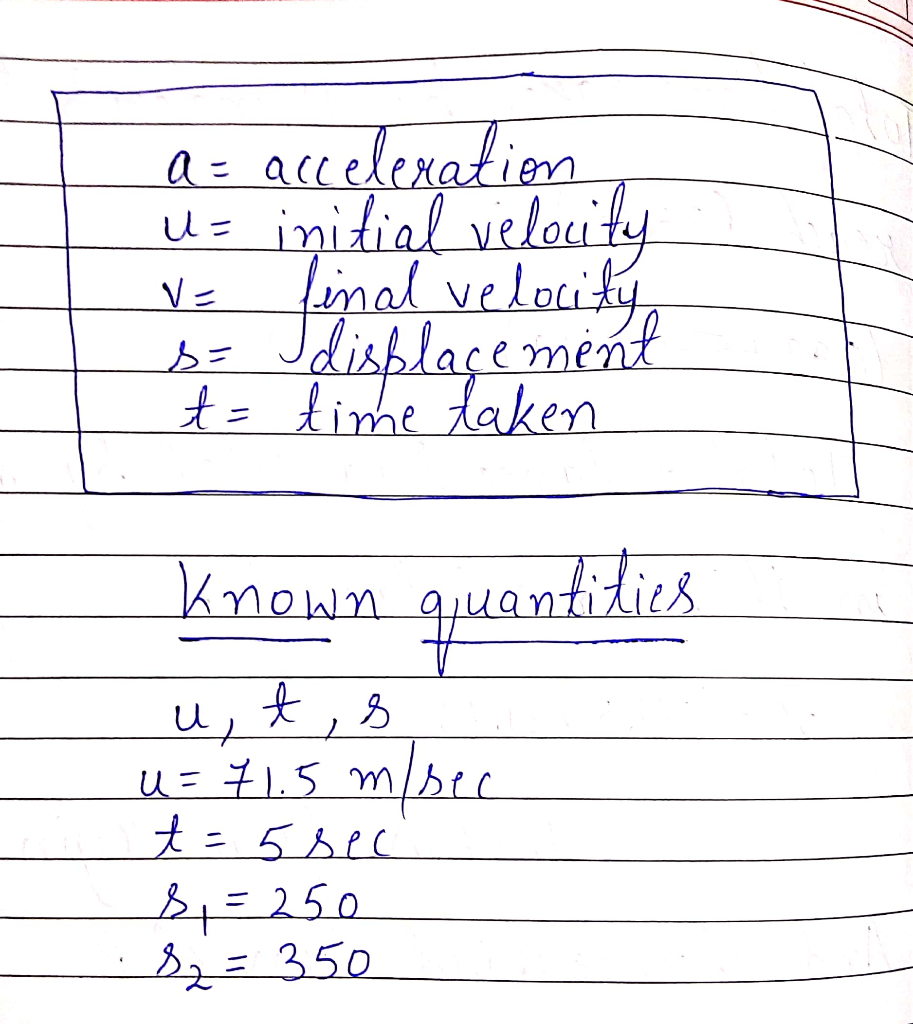
• Label all quantities in the diagram using standard notation.
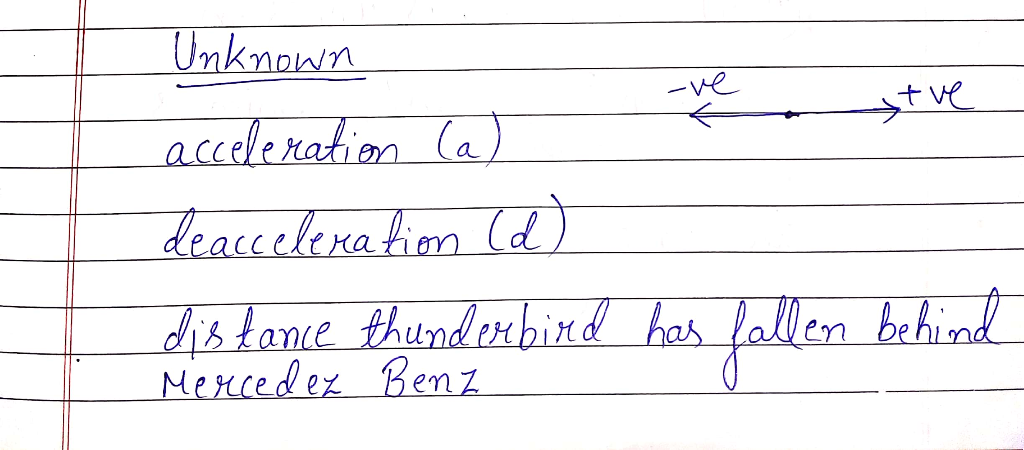
• List the known and unknown quantities. Circle the unknowns.
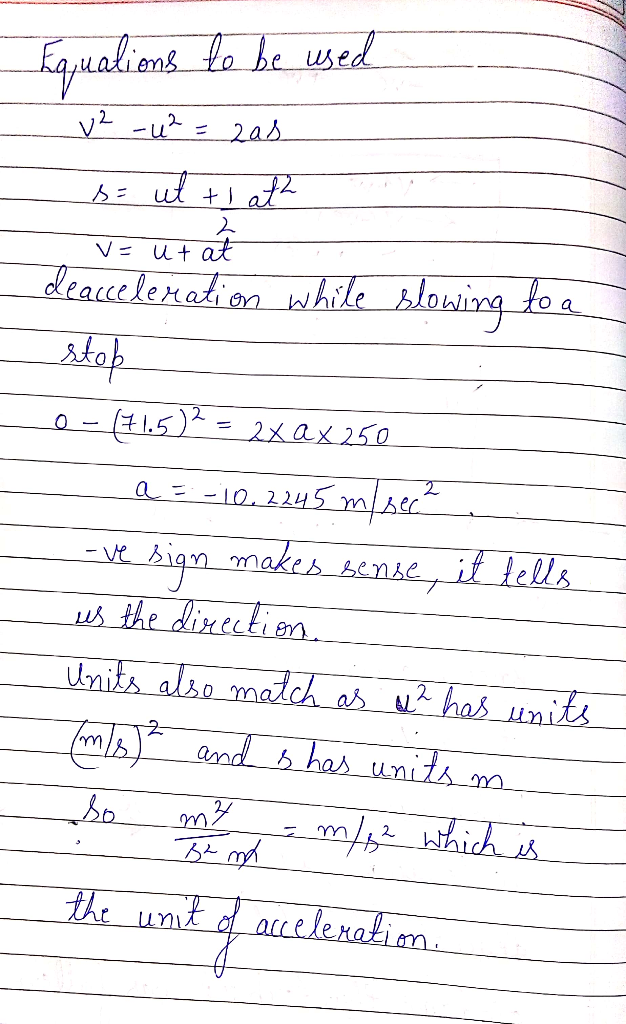
• Identify the equation you are using and show all your work. • At the end of each problem, check your answer. Do the units match? Is the answer reasonable? Does the plus or minus sign make sense?
3. In the Daytona 500 auto race, a Ford Thunderbird and a
Mercedes Benz are moving side by side down a straightaway at 71.5
m/s. The driver of the Thunderbird realizes that she must make a
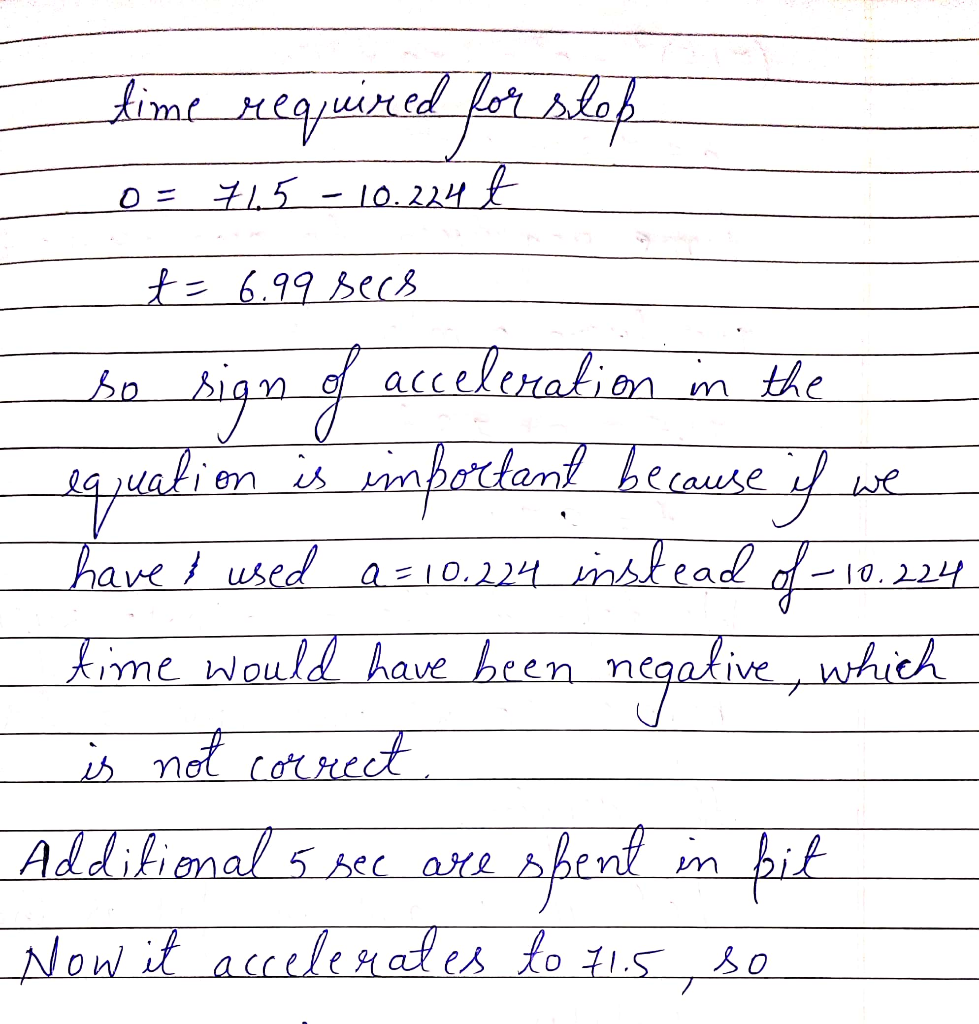
pit stop, and she smoothly slows to a stop over a distance of 250
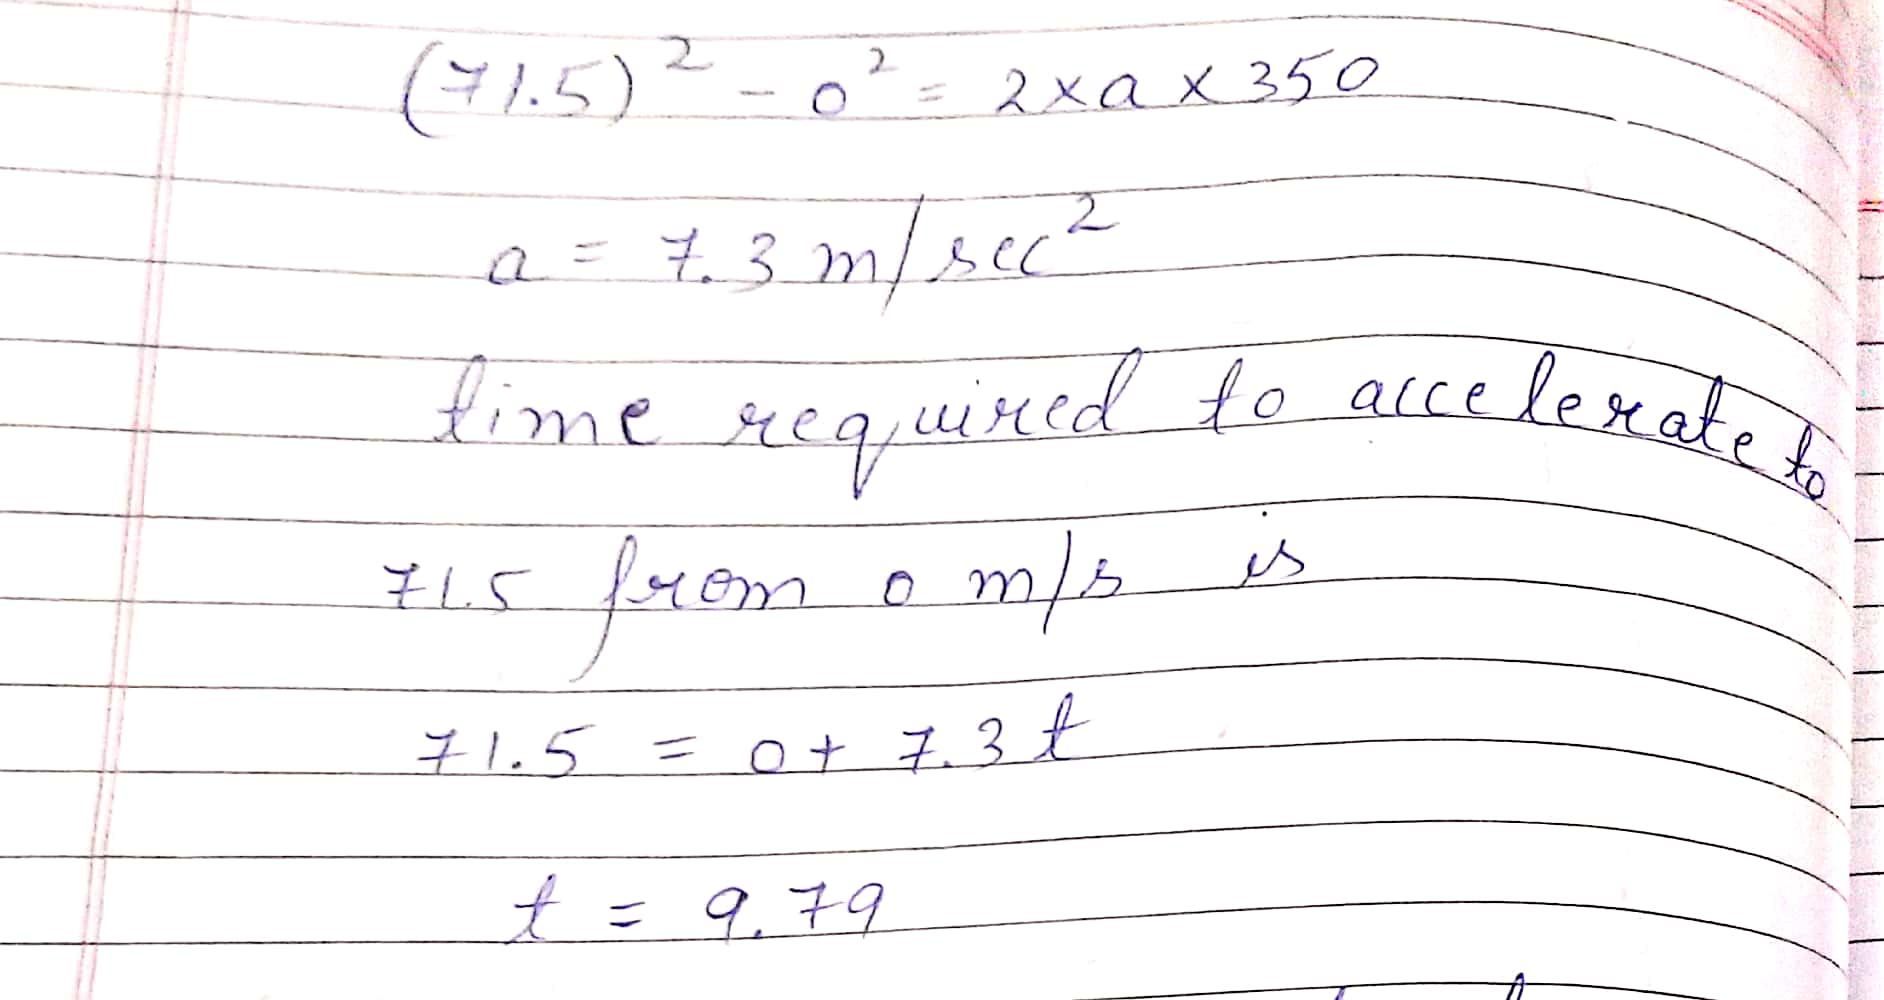
m. She spends 5.00 s in the pit and then accelerates out, reaching
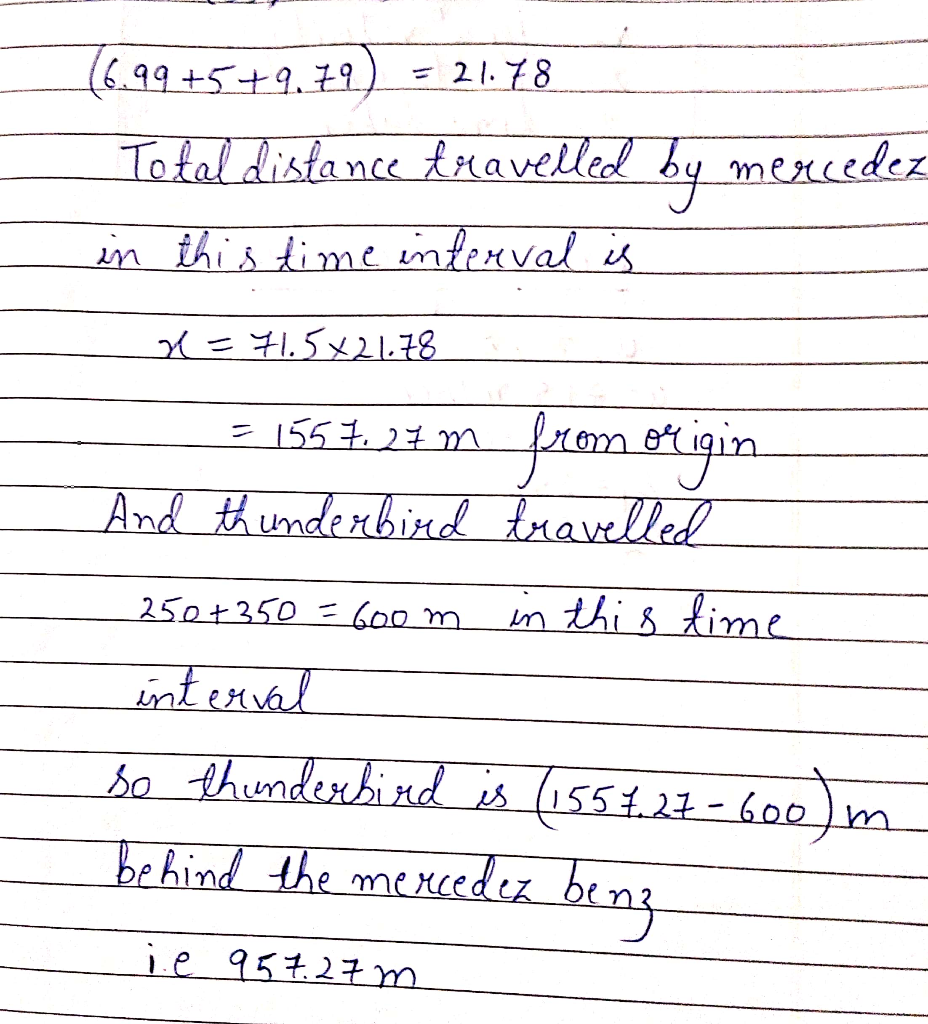
her previous speed of 71.5 m/s after a distance of 350 m. At this
point, how far has the Thunderbird fallen behind the Mercedes Benz,
which has continued at a constant speed?
Solutions
 genius_generous answered 2 months ago
Related Solutions
Draw and carefully and thoroughly label a block diagram of an “open loop” control system. Draw...
Draw a reaction coordinate for both an exothermic and an endothermic reaction. Be sure to label...
5. Draw a band diagram (label the component parts in your illustration) for the following ):...
a) Draw and label your own circuit diagram using standard schematic symbols for a circuit with...
1. Draw and label the band diagram for Carbon Monosulfide anion(CS^-) 2. Draw the MO diagram...
draw a bohr diagram sodium chloride. label the charges and or draw the stick model that...
5. Draw an entity-relationship diagram, including minimum and maximum cardinality, for the following: The system stores...
A)Draw and clearly label a diagram that shows the level of output at which a monopoly...
Question 3 (a) Draw and clearly label a diagram that shows the level of output at...
Draw and label a diagram showing the different sampling techniques. You must draw this manually (pencil and...
- Two 10-cm-diameter charged rings face each other, 15cm apart. The left ring is charged to -29nC...
- Under what conditions would it be possible for an excise tax to have no efficiency cost...
- explain the difference between activities and financial statements of service businesses and merchandising businesses.
- 2. Compare and compare the matrix multiplication algorithm and the Floyd-Warshall algorithm to find all pairs...
- Q: 50.00 ml of 0.5216 M copper(II) nitrate solution is combined with 100.0 ml of 0.5580...
- This is a business law question. Explain how environmental laws regulate the use of toxic substances...
- A sky diver and her parachute system weigh a total of 800 N. She is falling...