Question
In: Computer Science
Consider the following equation: f’(x) = 2.5x2 + π2 + e3 Assume f(0) = 0, for...
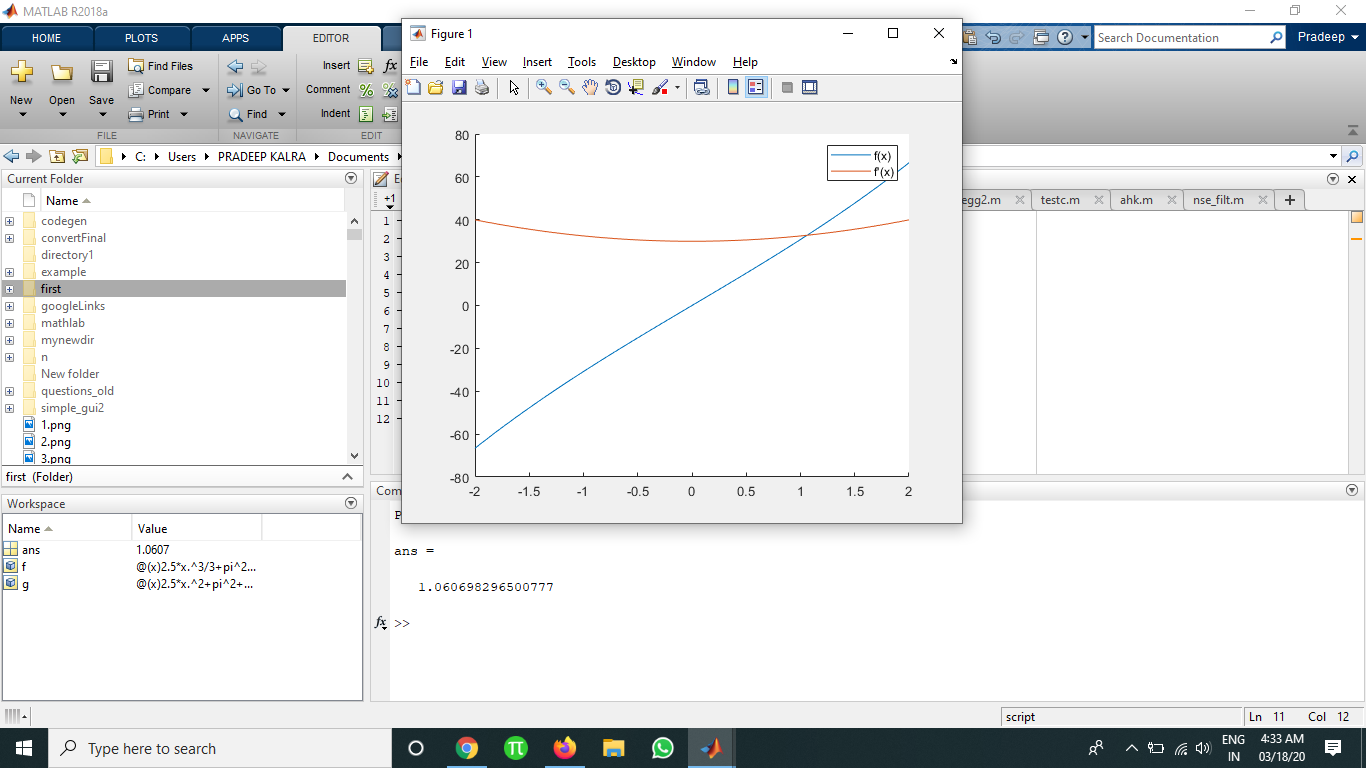
Consider the following equation: f’(x) = 2.5x2 + π2 + e3
Assume f(0) = 0, for x = -2 to 2, plot f’(x), its anti-derivative f(x) and the intersection point(s) between f’(x) and f(x) on the graph. Label the plots and provide a suitable legend. Then print out ONLY the intersection point(s) for f’(x) and f(x) for the above specified range. NOTE: Symbolic toolbox cannot be used for the following questions. Solve in Matlab language please.
Solutions
Expert Solution
`Hey,
Note: If you have any queries related the answer please do comment. I would be very happy to resolve all your queries.
clc%clears screen
clear all%clears history
close all%closes all files
format long
g=@(x) 2.5*x.^2+pi^2+exp(1)^3;
f=@(x) 2.5*x.^3/3+pi^2*x+exp(1)^3*x;
hold on;
fplot(f,[-2,2]);
fplot(g,[-2,2]);
legend('f(x)','f''(x)');
disp('Point of iintersection i')
fzero(@(x) f(x)-g(x),2)
Kindly revert for any queries
Thanks.
 venereology answered 2 months ago
Related Solutions
Consider the nonlinear equation f(x) = x3− 2x2 − x + 2 = 0. (a) Verify...
Suppose f is a twice differentiable function such that f′(x)>0 and f′′(x)<0 everywhere, and consider the...
Let f (x) = ex - 4x2 a) Show that equation f (x) = 0 has...
f(x)=0 if x≤0, f(x)=x^a if x>0 For what a is f continuous at x = 0...
Consider the function f(x)f(x) whose second derivative is f''(x)=5x+10sin(x)f′′(x)=5x+10sin(x). If f(0)=4f(0)=4 and f'(0)=4f′(0)=4, what is f(5)f(5)?....
Find f. f ''(x) = x−2, x > 0, f(1) = 0, f(4) = 0 f(x)=
Consider a function f(x) which satisfies the following properties: 1. f(x+y)=f(x) * f(y) 2. f(0) does...
1. Consider the following function F(x) = {2x / 25 0<x<5 {0 otherwise a) Prove...
4. Consider the triangular probability distribution with PDF f(x) = 0 if x <= 0 or...
Find f(x) for the following function. Then find f(6), f(0), and f(-7). f(x)=-2x^2+1x f(x)= f(6)= f(0)=...
- Based on what you learned in this module, identify one person who you believe possesses primarily...
- An Auditor may decide to make use of a specialist in obtaining sufficient appropriate audit evidence...
- Dirac's Theorem states that "A simple graph with n vertices (n >= 3) is Hamiltonian if...
- Two 10-cm-diameter charged rings face each other, 15cm apart. The left ring is charged to -29nC...
- Under what conditions would it be possible for an excise tax to have no efficiency cost...
- explain the difference between activities and financial statements of service businesses and merchandising businesses.
- 2. Compare and compare the matrix multiplication algorithm and the Floyd-Warshall algorithm to find all pairs...