Question
In: Math
Let x be a random variable representing percentage change in neighborhood population in the past few...
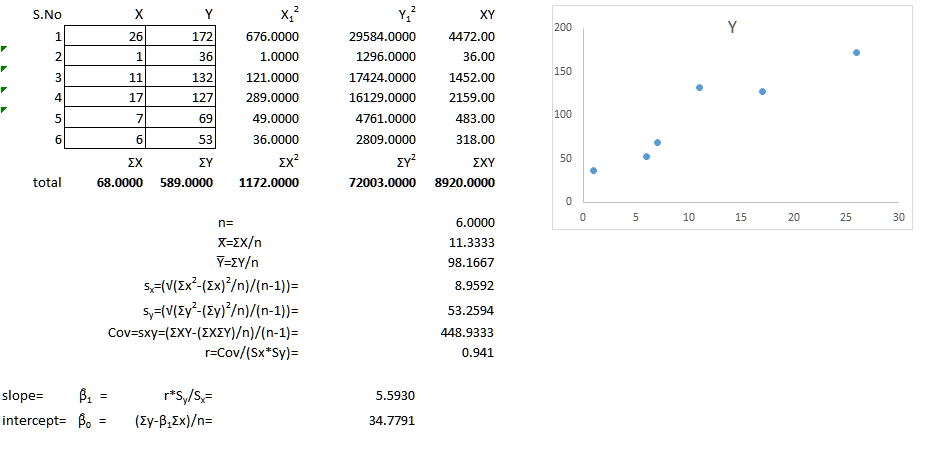
Let x be a random variable representing percentage change in neighborhood population in the past few years, and let y be a random variable representing crime rate (crimes per 1000 population). A random sample of six Denver neighborhoods gave the following information. x 26 1 11 17 7 6 y 172 36 132 127 69 53 In this setting we have Σx = 68, Σy = 589, Σx2 = 1172, Σy2 = 72,003, and Σxy = 8920.
(e) For a neighborhood with x = 14% change in population in the past few years, predict the change in the crime rate (per 1000 residents). (Round your answer to one decimal place.) crimes per 1000 residents
(f) Find Se. (Round your answer to three decimal places.)
Se =
(g) Find an 80% confidence interval for the change in crime rate when the percentage change in population is x = 14%. (Round your answers to one decimal place.)
lower limit crimes per 1000 residents
upper limit crimes per 1000 residents
(h) Test the claim that the slope β of the population least-squares line is not zero at the 1% level of significance. (Round your test statistic to three decimal places.)
t =
Find or estimate the P-value of the test statistic.
P-value > 0.250
0.125 < P-value < 0.250
0.100 < P-value < 0.125
0.075 < P-value < 0.100
0.050 < P-value < 0.075
0.025 < P-value < 0.050
0.010 < P-value < 0.025
0.005 < P-value < 0.010
0.0005 < P-value < 0.005
P-value < 0.0005
Conclusion
Reject the null hypothesis, there is sufficient evidence that β differs from 0.
Reject the null hypothesis, there is insufficient evidence that β differs from 0.
Fail to reject the null hypothesis, there is sufficient evidence that β differs from 0.
Fail to reject the null hypothesis, there is insufficient evidence that β differs from 0.
(i) Find an 80% confidence interval for β and interpret its meaning. (Round your answers to three decimal places.)
lower limit
upper limit
Interpretation
For every percentage point increase in population, the crime rate per 1,000 increases by an amount that falls outside the confidence interval.
For every percentage point decrease in population, the crime rate per 1,000 increases by an amount that falls outside the confidence interval.
For every percentage point increase in population, the crime rate per 1,000 increases by an amount that falls within the confidence interval.
For every percentage point decrease in population, the crime rate per 1,000 increases by an amount that falls within the confidence interval.
Solutions
Expert Solution
e)
| predicted value = | 113.1 | |||
f)
| Se =√(SSE/(n-2))= | 20.177 | |||
g)
| std error of confidence interval = | s*√(1+1/n+(x0-x̅)2/Sxx)= | 21.9580 | |||||
| for 80 % confidence and 4degree of freedom critical t= | 1.533 | ||||||
| 80% confidence interval =yo -/+ t*standard error= | (79.42,146.742) | ||||||
lower limit =79.4
upper limit =146.7
h)
| test statistic t = | r*(√(n-2)/(1-r2))= | 5.553 | ||
0.005 < P-value < 0.010
Reject the null hypothesis, there is sufficient evidence that β differs from 0.
i)
| std error of confidence interval = | s*√(1+1/n+(x0-x̅)2/Sxx)= | 21.9580 | |||||
| for 80 % confidence and 4degree of freedom critical t= | 1.533 | ||||||
| 80% confidence interval =yo -/+ t*standard error= | (79.42,146.742) | ||||||
lower limit=79.418
upper limit=146.742
For every percentage point increase in population, the crime rate per 1,000 increases by an amount that falls within the confidence interval.
 milcah answered 3 months ago
Related Solutions
Let x be a random variable representing percentage change in neighborhood population in the past few...
Let x be a random variable representing percentage change in neighborhood population in the past few...
Let x be a random variable representing percentage change in neighborhood population in the past few...
Let x be a random variable representing percentage change in neighborhood population in the past few...
Let x be a random variable representing percentage change in neighborhood population in the past few...
Let x be a random variable representing percentage change in neighborhood population in the past few...
Let x be a random variable representing percentage change in neighborhood population in the past few...
Let X be the random variable representing the number of calls received in an hour by...
Two dice are rolled. Let X be the random variable representing the result of the first...
Let X be a random variable representing the number of years of education an individual has,...
- Dirac's Theorem states that "A simple graph with n vertices (n >= 3) is Hamiltonian if...
- Two 10-cm-diameter charged rings face each other, 15cm apart. The left ring is charged to -29nC...
- Under what conditions would it be possible for an excise tax to have no efficiency cost...
- explain the difference between activities and financial statements of service businesses and merchandising businesses.
- 2. Compare and compare the matrix multiplication algorithm and the Floyd-Warshall algorithm to find all pairs...
- Q: 50.00 ml of 0.5216 M copper(II) nitrate solution is combined with 100.0 ml of 0.5580...
- This is a business law question. Explain how environmental laws regulate the use of toxic substances...