Question
In: Math
There are a number of steps involved in testing hypotheses. The mechanics of testing a hypothesis...
There are a number of steps involved in testing hypotheses. The mechanics of testing a hypothesis are not difficult, but the underlying logic requires quite a bit more explanation. In this activity, you will start by working through the steps of hypothesis testing to give you some experience with the process. Then, you will work through the steps for that same problem in far more detail. Finally, there is some logic that is inherent in the process of hypothesis testing that is not obvious in the steps but is vitally important to your understanding. The last part of this activity explains that logic. Let’s start with an example: Suppose you are an educational researcher who wants to increase the science test scores of high school students. Based on tremendous amounts of previous research, you know that the national average test score for all senior high school students in the United States is 50 with a standard deviation of 20. In other words, 50 and 20 are the known population parameters for the mean and the standard deviation, respectively (i.e., µ = 50, σ = 20). You also know that this population of test scores has a normal shape. You and your research team take a sample of 16 high school seniors (N = 16), help them for 2 months, and then give them the national science test to determine if their test scores after help were higher than the national average science test score of 50 (i.e., µ = 50). After the help, the mean test score of the 16 student sample was M = 61 (SD = 21). Now you need to determine if the difference between the sample’s mean of 61 and the population mean of 50 is likely to be due to sampling error or if the help improved the sample’s science test score. Because you are only interested in adopting the help program if it increases science test scores, you use a one-tailed hypothesis test. You also chose a .05 alpha value (i.e., α = .05) as the decision criterion for your significance test. If the sample mean has a chance probability less than .05, you will conclude that the help program improved students’ test scores.
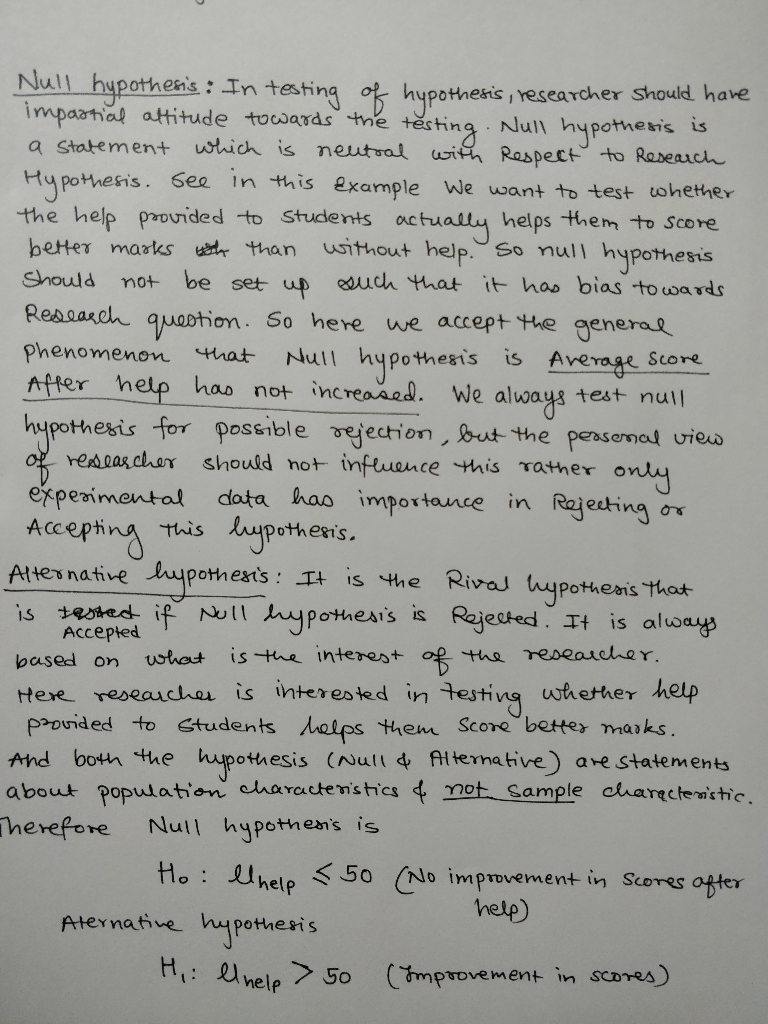
2. Write H0 next to the symbolic notation for the null hypothesis and H1 next to the research hypothesis.
______µhelp > 50 ______µhelp < 50 ______µhelp ≥ 50 ______µhelp ≤ 50 ______µhelp > 61 ______µhelp < 61 ______µhelp ≥ 61 ______µhelp ≤ 61
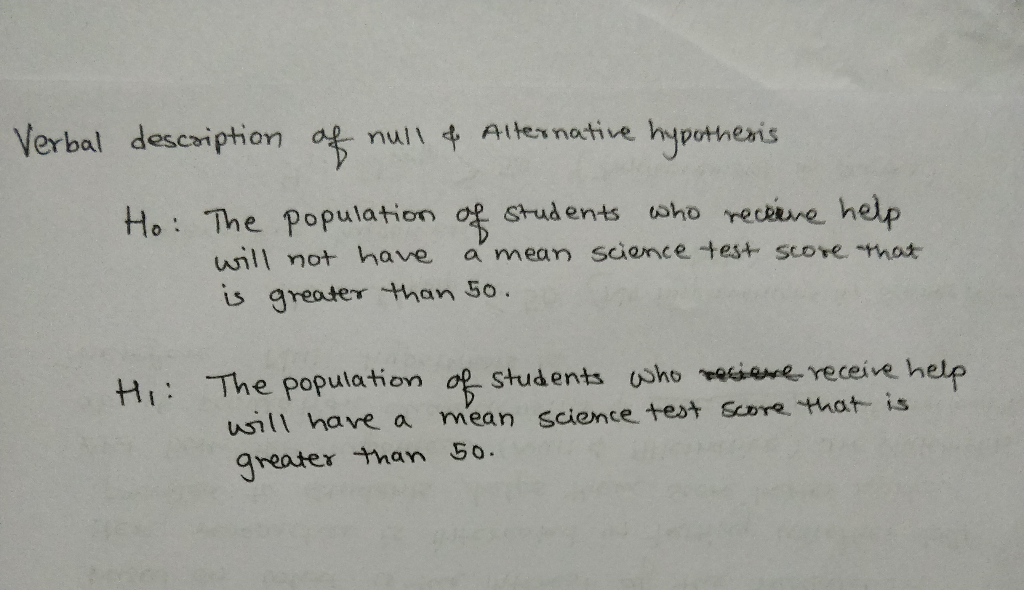
3. Write H0 next to the verbal description of the null hypothesis and H1 next to the research hypothesis.
_____The population of students who receive help will have a mean science test score that is equal to 50. _____The population of students who receive help will have a mean science test score that is greater than 50. _____The population of students who receive help will not have a mean science test score that is greater than 50. _____The population of students who receive help will have a mean science test score that is less than 50.
Solutions
 milcah answered 4 months ago
Related Solutions
What are the steps in hypothesis testing? What is the goal of hypothesis testing? What are...
For each problem students will write out all steps of hypothesis testing including populations, hypotheses, cutoff...
1)explain the four major steps involved in Hypothesis Testing. which step you feel will be the...
List and explain the steps in hypothesis testing
Hypothesis Testing – Indicate five steps in your answers (Null/alternate hypotheses, test-statistic, rejection area, decision for...
Hypothesis Testing – Indicate five steps in your answers (Null/alternate hypotheses, test-statistic, rejection area, decision for...
Explain the following: Concepts of Hypothesis Testing Hypotheses Test for a population mean Hypothesis test for...
Consider the seven steps of hypothesis testing. The final step in the hypothesis-testing process involves deciding...
Hypothesis Testing – Indicate five steps ion your answers (Null/alternate hypotheses, test-statistic, rejection area, decision for...
21. Identify and describe the five steps in hypothesis testing.
- Question 3 (a) What do you understand by a time series forecasting approach? Describe each of...
- 1 Which of the following overflow values clips all content that extends beyond the containing element’s...
- What are the key environmental and biological controls over decomposition rate in ecosystems?
- describe why independent oversight is important to taxpayers.
- Graph a Monopoly. Compare the price, quantity, and ATC of a monopoly with a perfectly competitive...
- Problem 18-12 Various shareholders' equity topics; comprehensive [LO18-1, 18-4, 18-5, 18-6, 18-7, 18-8] Part A In...
- Hello There, This is discussion Question For Advanced Database Systems Question: (a) Please define what a...