Question
In: Economics
Assume two neighbors who live next to a pond. Both neighbors get together to determine how...
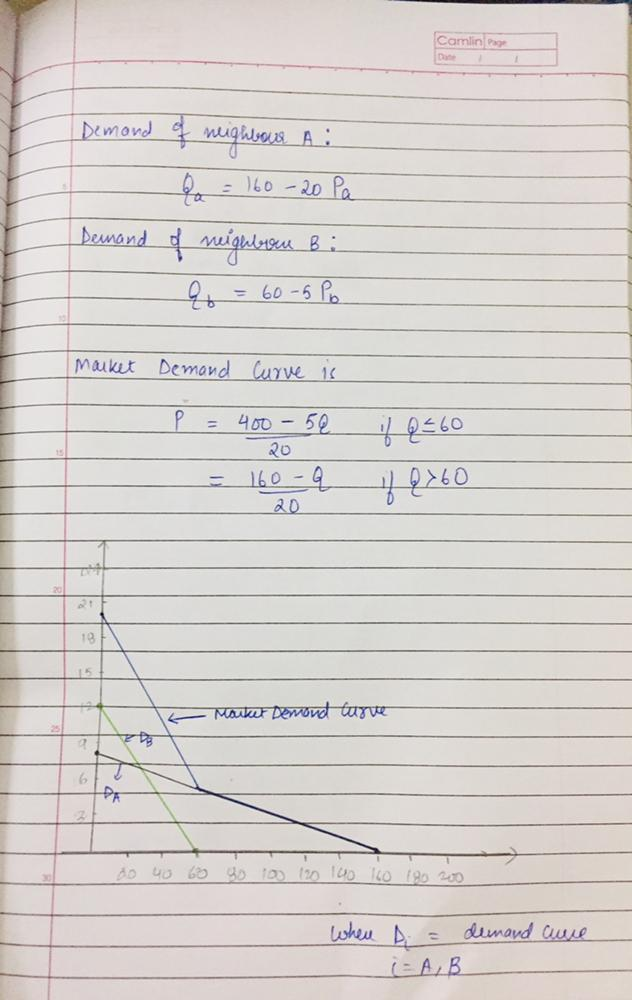
Assume two neighbors who live next to a pond. Both neighbors get together to determine how each of them value a large deck overseeing the pond. After some economic analysis, they arrive at the following demand estimates: Qa = 160 − 20Pa , Qb = 60 − 5Pb where Q is the size of the deck to be built and P is the price of inputs and labor.
a) Based on these estimates, determine the market demand (assuming these are the only two households living next to the pond) for this public good, the deck overlooking the pond. Draw three graphs on the top of each other -first graph for A’s demand, a second graph for B’s demand, and the third graph for the market demand.
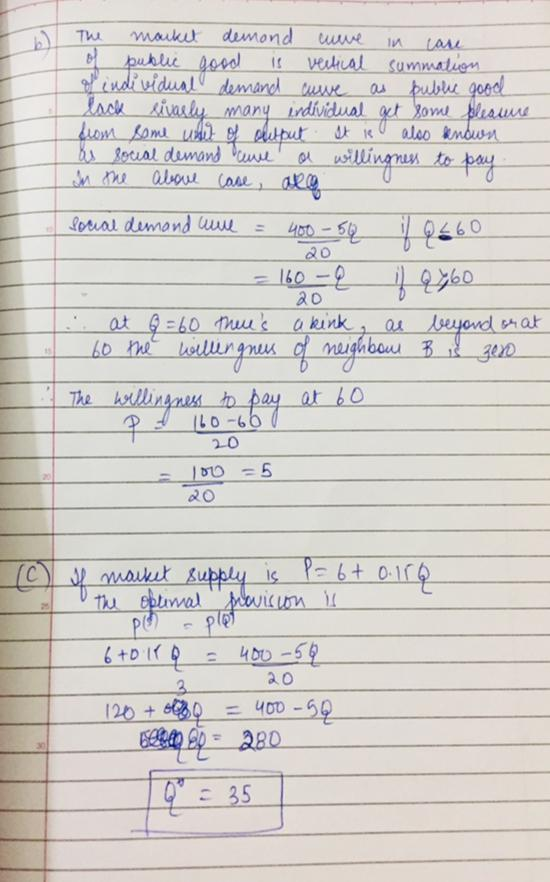
b) Explain the shape of the demand curve. Determine the willingness to pay when the size of the pond is 60 square feet.
c) If the market supply for pond decks were P= 6 + 0.15Q, what would be the optimal provision of this public good, that is what would the size of the pond?
d) Which neighbor is more likely to build the pond? Explain your answer.
Solutions

 Rahul Sunny answered 3 months ago
Related Solutions
Assume two neighbors who live next to a pond. Both neighbors get together to determine how...
TYPED ANSWER ONLY A school psychologist wants to determine whether children who live with both parents...
Are couples that live together before they get married more likely to end up divorced within...
Are couples that live together before they get married more likely to end up divorced within...
Brian, Edison, and Kevin are lumberjacks who live next to a forest that is open to...
The elements radium and astatine both arise during the radioactive decay of uranium. They get together...
What factors might explain why couples who cohabit (live together) before marriage sometimes are not as...
This video is a brief tale of two mice and two humans who live in a...
Suppose there are two agents Richy and Poory. Both of the live for two periods: Today...
Assume that you are one of six thousand people who live on the small island of...
- In 2012, cost per Medicare beneficiary did what?
- 3. A. What techniques can a firm use to optimize demand deposit holdings? B. How do...
- The half-life of mercury-197 is 64.1 hours. If a patient undergoing a kidney scan is given...
- Double bonds react with Br2 to form a dibromide. Isobutylene undergoes cationic polymerization under conditions where...
- 1. Which sex chromosomes are limited to only one sex? A. X and Z B. X...
- prepare a tecnical report that discuss about "A custom Union (CU) constitute a partial movement towards...
- in your own opinion, It has been said that a smartphone is a computer in your...