Question
In: Economics
Draw the supply and demand graph for coffee below assuming the market operates at an equilibrium...
- Draw the supply and demand graph for coffee below assuming the market operates at an equilibrium price of $2.40 and an equilibrium quantity of 5,000.
- Assuming tea and coffee are substitutes, what will happen in the market for coffee if the price of tea increases? Show the effects on your market.
- Based on this information, will producer surplus in the market for coffee increase or decrease? Explain.
Solutions
Expert Solution
Answer: We start by assuming that the market for coffee operates at an equilibrium price of $2.40 and an equilibrium quantity of 5000. Now as tea and coffee are perfect substitutes, an increase in the price of tea will increase the demand for coffee as consumers will switch to coffee consumption because of higher price of tea. As a result of this higher demand, the demand curve for coffee will shift rightward from D1 to D2 and as the economy moves from point A to point B, the equilibrium price of coffee rises from $2.40 to P2 and the equilibrium quantity of coffee increases from 5000 to Q2.
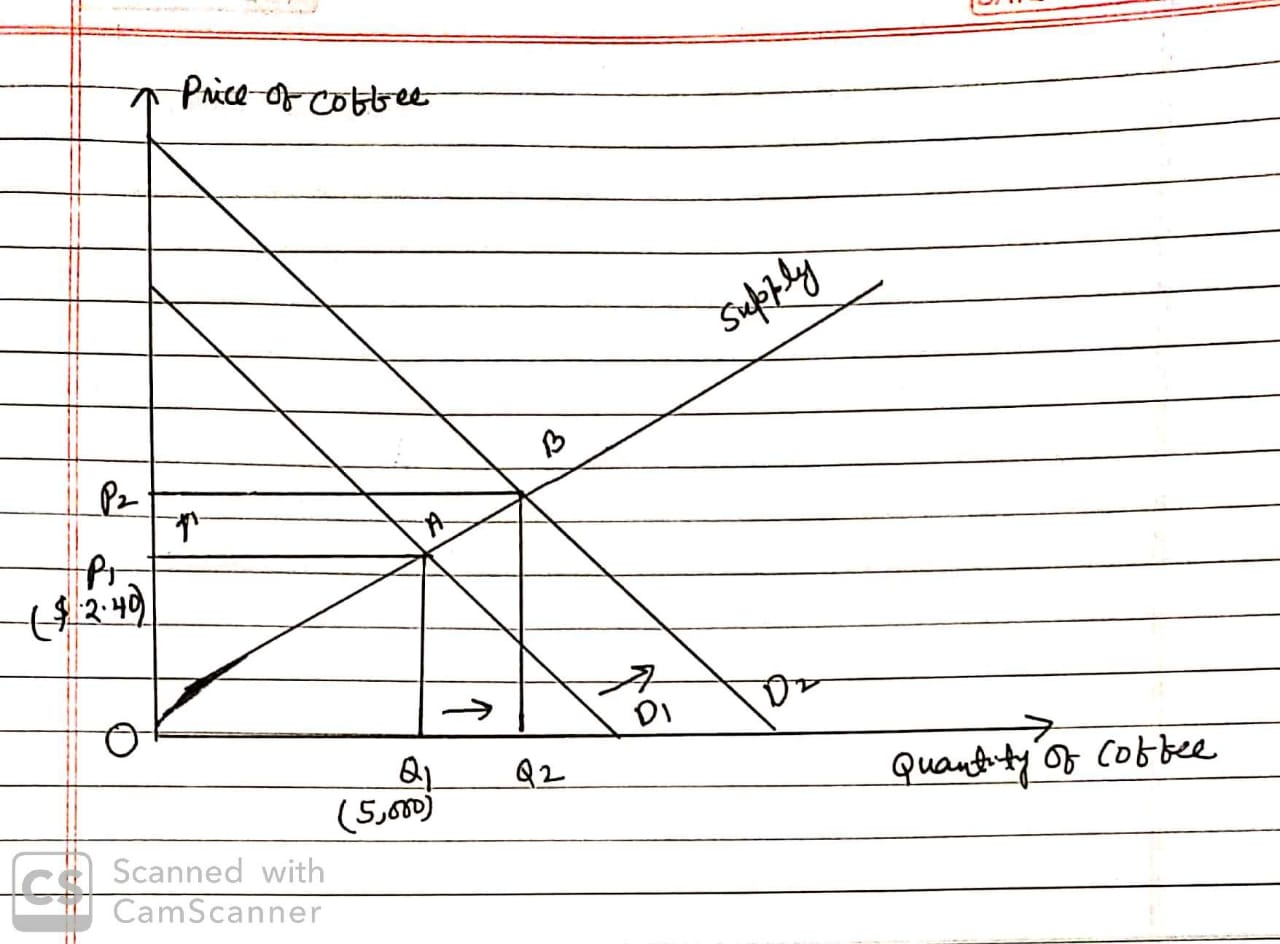
We know that producer surplus is measured by the area
above the supply curve and below the equilibrium price level. Here
as the demand curve shifts rightward due to the increased demand
for coffee, the price and quantity of coffee both increases and as
a result of which producer surplus increases from the area of the
 OAP1 to the area of the
OBP2 (refer to the above diagram).
OAP1 to the area of the
OBP2 (refer to the above diagram).
 Rahul Sunny answered 5 months ago
Related Solutions
Given a scenario, draw a supply/demand graph, beginning with a market in equilibrium, and show the...
Draw a completely labeled supply and demand graph. Show the equilibrium point, the equilibrium price and...
Draw a graph showing the market demand and supply for beef and the demand for beef...
Draw a graph of the supply and demand for the U.S. dollar by the Australian market....
Draw a supply and a demand curve and label the market equilibrium on the axes with...
Draw a supply and a demand curve and label the market equilibrium on the axes with...
on a graph, draw the supply and demand curves for juul pods, labeling the equilibrium price...
Draw a supply and demand graph in the market for bread. The government decides to impose...
Consider again the market for ice cream. a.) Draw a graph of the supply and demand...
Part 1: Draw a loanable funds graph in initial equilibrium (show demand and supply intersecting then...
- Two 10-cm-diameter charged rings face each other, 15cm apart. The left ring is charged to -29nC...
- Under what conditions would it be possible for an excise tax to have no efficiency cost...
- explain the difference between activities and financial statements of service businesses and merchandising businesses.
- 2. Compare and compare the matrix multiplication algorithm and the Floyd-Warshall algorithm to find all pairs...
- Q: 50.00 ml of 0.5216 M copper(II) nitrate solution is combined with 100.0 ml of 0.5580...
- This is a business law question. Explain how environmental laws regulate the use of toxic substances...
- A sky diver and her parachute system weigh a total of 800 N. She is falling...