Question
In: Math
How do you interpret the price indices in Exhibit 3? How do economists construct them? Use...
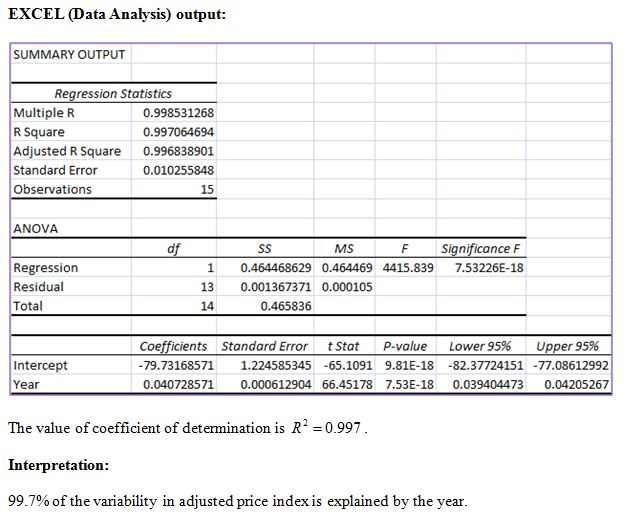
How do you interpret the price indices in Exhibit 3? How do economists construct them? Use Excel regression to analyze the relationship between the adjusted price index (dependent variable and year (independent variable). Interpret your regression findings by discussing the coefficient of determination (R-squared), the regression coefficient, the regression equation, and the p value. Can you use the regression equation to predict the price indices? Take into account statistical, macroeconomic, and other considerations.
EXHIBIT 3
|
Number |
Year |
Gross Income |
Price Index |
Adjusted Price Index |
Real Income |
|
1 |
1991 |
50,599 |
136.2 |
1.362 |
37150.51 |
|
2 |
1992 |
53,109 |
140.3 |
1.403 |
37853.88 |
|
3 |
1993 |
53,301 |
144.5 |
1.445 |
36886.51 |
|
4 |
1994 |
56,885 |
148.2 |
1.482 |
38383.94 |
|
5 |
1995 |
56,745 |
152.4 |
1.524 |
37234.25 |
|
6 |
1996 |
60,493 |
156.9 |
1.569 |
38555.13 |
|
7 |
1997 |
61,978 |
160.5 |
1.605 |
38615.58 |
|
8 |
1998 |
61,631 |
163 |
1.630 |
37810.43 |
|
9 |
1999 |
63,297 |
166.6 |
1.666 |
37993.40 |
|
10 |
2000 |
66,531 |
172.2 |
1.722 |
38635.89 |
|
11 |
2001 |
67,600 |
177.1 |
1.771 |
38170.53 |
|
12 |
2002 |
66,889 |
179.9 |
1.799 |
37181.21 |
|
13 |
2003 |
70,024 |
184 |
1.840 |
38056.52 |
|
14 |
2004 |
70,056 |
188.9 |
1.889 |
37086.29 |
|
15 |
2005 |
71,857 |
195.3 |
1.953 |
36793.14 |
Solutions
 milcah answered 6 months ago
Related Solutions
How do economists use the concepts of marginal utility and budget constraints to construct demand curves...
What are neurons? How to use them to construct AND, OR, and NOT gates?
how to interpret confidence intervals and how NOT to interpret them. What are the assumptions to...
How do you interpret a t value? When would it be appropriate to use a t...
What are the ledgers, why do we use them? And then HOW do we use them,...
What are chi distributions, how do we use them, when do we use them, and why...
Discuss the importance of trust during negotiations? How do you exhibit it? How do you know...
Discuss the importance of trust during negotiations? How do you exhibit it? How do you know...
How do you interpret t statistic? Please give examples and describe how to interpret t statistic...
Quality Indices: Mayo Clinic Review quality indices of Mayo Clinic. How do they compare to each...
- Two 10-cm-diameter charged rings face each other, 15cm apart. The left ring is charged to -29nC...
- Under what conditions would it be possible for an excise tax to have no efficiency cost...
- explain the difference between activities and financial statements of service businesses and merchandising businesses.
- 2. Compare and compare the matrix multiplication algorithm and the Floyd-Warshall algorithm to find all pairs...
- Q: 50.00 ml of 0.5216 M copper(II) nitrate solution is combined with 100.0 ml of 0.5580...
- This is a business law question. Explain how environmental laws regulate the use of toxic substances...
- A sky diver and her parachute system weigh a total of 800 N. She is falling...