Question
In: Biology
Results table Bradford (mL) BSA (μL) Absorbance 3 0 0 3 10 0.228 3 20 0.402...
Results table
|
Bradford (mL) |
BSA (μL) |
Absorbance |
|
3 |
0 |
0 |
|
3 |
10 |
0.228 |
|
3 |
20 |
0.402 |
|
3 |
30 |
0.553 |
|
3 |
40 |
0.715 |
|
3 |
50 |
0.776 |
|
3 |
30 |
0.58 unknown |
- Graph your standard curve by plotting protein content in the abscissa and absorbance in the ordinate.
- Calculate the protein content of your samples.
Solutions
Expert Solution
The Bradford assay is based on an absorbance change of the dye Coomassie Brilliant Blue. The more protein present, the more Coomassie binds. The Bovine Serum Albumin (BSA) is the most widely used protein as the standard to calculate the protein content in a sample.
To know the protein content we must plot the protein content and the absorbance:
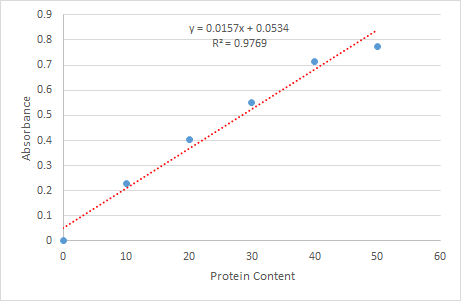
We must calculate a linear regression curve through these points to determine the equation of the straight line in the form of "y = mx + b" where y = absorbance and x = protein concentration. Several scientific graphing packages calculate this equation, in this case, I used excel to obtain the equation, which is:
y = 0.0157x + 0.0534
With a coefficient of determination R2 ≥ 0.95, that means that is a reliable linear regression curve
Then, we can calculate the protein content by knowing the "y" value which is 0.58 (the absorbance value)
We clear the "x" from the equation and we get
x = (y - 0.0534) / 0.0157
Substitute "y" value
x = ( 0.58 - 0.0534) / 0.0157
x = 33.54
The absorbance from the unknown sample was 0.58, then, its protein content is 33.54
 gladiator answered 8 months ago
Related Solutions
Consider the following table: Labor Output Marginal Product 0 0 ? 10 100 ? 20...
Your supervisor wants you to dilute a 1 mL stock BSA solution (1 mg/mL) into 1:10...
Classes (Percentage) No of Students 0 < 10 10 10 < 20 20 20 < 30...
On a pool table, four holes are labeled 0, 10, 20 and 50. On each play,...
20 mL of 4.0 M acetone + 10 mL of 1.0 M HCl + 20 mL...
What is the number of routes from (0, 0, 0) to (0, 20, −10) such that...
1 5 mL of 3% H2O2 & 10 mL of 0.60M KI 5 mL of 3%...
Please answer it with explanation A Table 1 Output (units per day) 0 10 20 30 Total...
Refer to the table to answer questions 1-3. Units TR TC MC MR Profit 0 20...
3.The Bradford Company issued 10% bonds, dated January 1, with a face amount of $80 million...
- Example: We are looking at the cholesterol levels of population of 200 healthy individuals. Cholesterol of...
- In an experiment on the Reaction of Magnesium with Hydrochloric Acid. What would be the effect...
- sort_employees(Employee emps[], int size) (40 pts) This function should sort the input array based on each...
- Write the program in JAVA. Make an undirected, but disconnected graph of at least 15 vertices...
- Teen Smoking Project CHAPTER 0. Preliminary Discussion Question: 1. What conjectures (educated guesses) could be made...
- In reviewing firm liquidity situations, lenders often count on the Quick Ratio (or Acid-Test ratio). Why...
- code a Java program that: Requests from the user for a text filename to read the...