Question
In: Math
The American Society of PeriAnesthesia Nurses (ASPAN; www.aspan.org) is a national organization serving nurses practicing in...
The American Society of PeriAnesthesia Nurses (ASPAN; www.aspan.org) is a national organization serving nurses practicing in ambulatory surgery, preanesthesia, and postanesthesia care. The organization's membership is listed below.
| State/Region | Membership | ||
| Alabama | 102 | ||
| Arizona | 420 | ||
| Maryland, Delaware, DC | 471 | ||
| Connecticut | 177 | ||
| Florida | 432 | ||
| Georgia | 330 | ||
| Hawaii | 84 | ||
| Maine | 51 | ||
| Minnesota, Dakotas | 360 | ||
| Missouri, Kansas | 325 | ||
| Mississippi | 128 | ||
| Nebraska | 77 | ||
| North Carolina | 368 | ||
| Nevada | 121 | ||
| New Jersey, Bermuda | 508 | ||
| Alaska, Idaho, Montana,Oregon, Washington | 716 | ||
| New York | 1,016 | ||
| Ohio | 833 | ||
| Oklahoma | 209 | ||
| Arkansas | 89 | ||
| Illinois | 492 | ||
| Indiana | 332 | ||
| Iowa | 83 | ||
| Kentucky | 236 | ||
| Louisiana | 290 | ||
| Michigan | 413 | ||
| Massachusetts | 540 | ||
| California | 1,173 | ||
| New Mexico | 62 | ||
| Pennsylvania | 443 | ||
| Rhode Island | 43 | ||
| Colorado | 443 | ||
| South Carolina | 281 | ||
| Texas | 1,168 | ||
| Tennessee | 169 | ||
| Utah | 88 | ||
| Virginia | 412 | ||
| Vermont, New Hampshire | 109 | ||
| Wisconsin | 471 | ||
| West Virginia | 77 | ||
|
Mean: Median: Standard Deviation: b-1. Find the coefficient of skewness, using the software method. (Round your answer to 2 decimal places.) Coefficient of skewness: b-2. What do you conclude about the shape of the distribution of component size? a. Mild positive skewness b. Mild negative skewness c. Determine the first and third quartiles. Do not use the method described by Excel. (Round your answers to 2 decimal places.) First Quartile: Third Quartile: d-1. Are there any outliers? a. Three b. One c. Two d. Four e. Zero d-2. What are the limits for outliers? (Round your answers to the nearest whole number. Negative amounts should be indicated by a minus sign.) Limits _____ to _____ |
|||
Solutions
Expert Solution
a)
Mean = Total of Values/Count of Values = 14142/40 = 353.55
Median is the middle value when arranged in ascending order. Since the total count is even, Median will be the average of the two middle values.
Median = 327.5
Standard deviation:
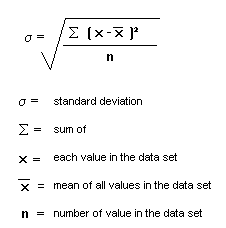
Using the above formulae,
Standard Deviation of the data(σ) = 292.01
B1)
Skewness = 1.39
B2)
A distribution is skewed if one of its tails is longer than the other. Since our histogram has a long tail in the positive direction it is mild positively skewed.
c)
Steps to find Quartile 1 and 3
- First, we write data in increasing order
- Find the median
- the lower half of the data is minimum value till median
- The first quartile, Q1, is the median of the values of lower half
- Similarly, upper half of the data is median till maximum value
- The third quartile, Q3, is the median of the values of upper half
Q1 = 107.25
Q3 = 450
d2)
Inter Quartile Range (IQR) = Q3-Q1 = 342.75
Range to identify Outliers ie {Q1-1.5*IQR, Q3+1.5*IQR} ie
{-406.88,964.13}
Limits: -406.88 to 964.13
d1)
Since 3 data points are outside this interval, hence there are 3 outliers.
 milcah answered 8 months ago
Related Solutions
The American Society of PeriAnesthesia Nurses (ASPAN; www.aspan.org) is a national organization serving nurses practicing in...
The American Society of PeriAnesthesia Nurses (ASPAN; www.aspan.org) is a national organization serving nurses practicing in...
The American Society of PeriAnesthesia Nurses (ASPAN; www.aspan.org) is a national organization serving nurses practicing in...
The American Society of PeriAnesthesia Nurses (ASPAN; www.aspan.org) is a national organization serving nurses practicing in...
The American Society of PeriAnesthesia Nurses (ASPAN; www.aspan.org) is a national organization serving nurses practicing in...
EA2. LO 9.3Consider the national nonprofit organization the American Red Cross. Assume you are the regional...
- The output of the function is a dictionary whose keys represent the bins and whose values...
- The shape of a graph of a binomial distribution depends on the value of both n...
- In 2012, cost per Medicare beneficiary did what?
- 3. A. What techniques can a firm use to optimize demand deposit holdings? B. How do...
- The half-life of mercury-197 is 64.1 hours. If a patient undergoing a kidney scan is given...
- Double bonds react with Br2 to form a dibromide. Isobutylene undergoes cationic polymerization under conditions where...
- 1. Which sex chromosomes are limited to only one sex? A. X and Z B. X...