Question
In: Math
Golf and Chi-Square Tests Discussion Introduction This discussion provides a simulated exercise using two of the...
Golf and Chi-Square Tests
Discussion
Introduction
This discussion provides a simulated exercise using two of the most popular Chi-Square statistical tests. You are strongly encouraged to complete the textbook reading and start the MyStatLab Homework assignment before beginning this discussion. You need to be familiar with the Chi-Square distribution, its interpretation, and how results are typically calculated and reported together.
In this discussion, you are required to calculate and interpret your findings.
Review the information in each section and participate in the discussion.
Golf Rounds Scenario
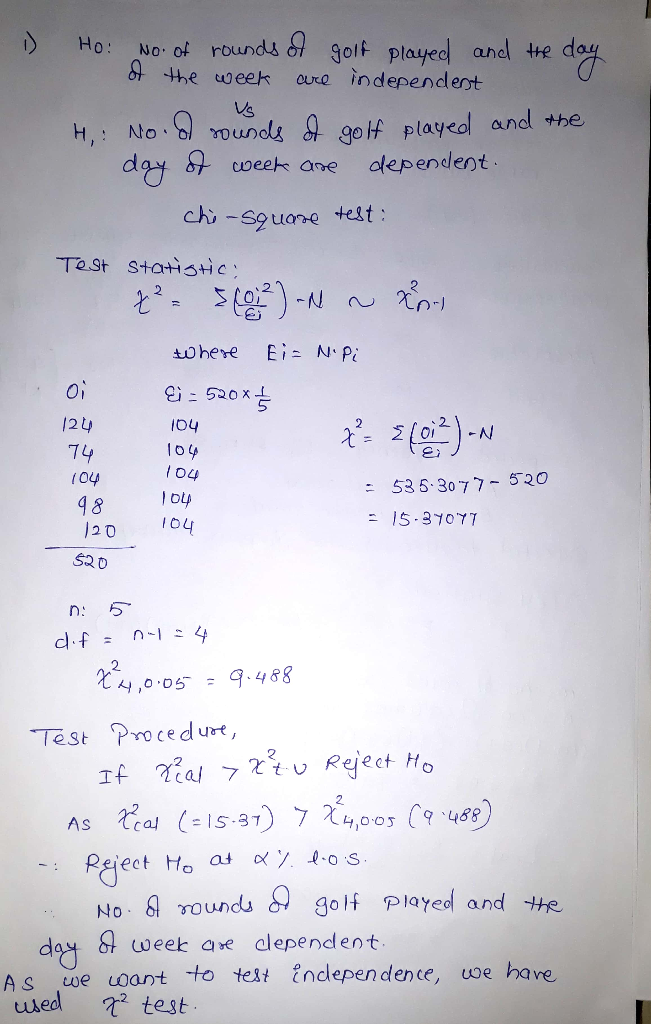
As the Director of Golf for the Links Group, you are trying to determine if there is a significant difference in the number of rounds of golf played based on the day of the week. So far, you've gathered the following sample information for 520 rounds.
| Day of the Week | Number of Rounds Played |
|---|---|
| Monday | 124 |
| Tuesday | 74 |
| Wednesday | 104 |
| Thursday | 98 |
| Friday | 120 |
Now, you need to use the sample to answer these questions. For each question, the null hypothesis is that the cell categories are equal, and the significance level is .05.
- Is there a significant difference in the rounds of golf played during the week? Why is your choice appropriate?
- What is the critical value and number of degrees of freedom for the Chi-Square statistic?
- What is your decision regarding the null hypothesis? Why is your decision appropriate?
Golf Ball Quality Scenario
In addition to determining if there is a significant difference in the number of rounds of golf played based on the day of the week, you also have to determine which brand of "range balls" to buy for use at the driving range. You are looking for the most durable ball that will hold up for an extended period. You obtained samples of 100 golf balls from four different manufacturers, and your teaching professionals tested them for durability. The table shows the numbers of unacceptable and acceptable golf balls by manufacturer.
| Durability | Nike | Srixon | TaylorMade | Titleist |
|---|---|---|---|---|
| Unacceptable | 12 | 8 | 5 | 11 |
| Acceptable | 88 | 92 | 95 | 89 |
| Total | 100 | 100 | 100 | 100 |
At the .05 significance level, is there a difference in the durability of the range balls? Why is your decision appropriate?
Additional Instructions
Use Excel or Statdisk to answer the questions posed in both scenarios. Remember, the focus of this discussion is understanding and interpreting two different Chi-Square tests.
Solutions


 milcah answered 10 months ago
Related Solutions
Week 10 Discussion Chi-square tests are nonparametric tests that examine nominal categories as opposed to numerical...
Explain how the chi-square tests differ from parametric tests (such as t tests or ANOVA) with...
Assignment #7: One-sample Chi-Square Directions: Use the Chi-Square option in the Nonparametric Tests menu to answer...
Assignment #7: One-sample Chi-Square Directions: Use the Chi-Square option in the Nonparametric Tests menu to answer...
Chi-Square Test for Independence Using Chi-Square, we are looking to see if there is a significant...
Chi-Square Test for Independence Using Chi-Square, we are looking to see if there is a significant...
Chi-square tests are nonparametric tests that examine nominal categories as opposed to numerical values. Consider a...
Chi-square tests are nonparametric tests that examine nominal categories as opposed to numerical values. Consider a...
Using the Chi-Square test for the difference between two proportions, determine (?=0.05) if there is a...
In Chi-square goodness of fit and contingency table tests, it is sometimes necessary to reduce the...
- On January 1, 2018, bonds with a face value of $ 79,000 were sold. The bonds...
- How do I make this sort in true alphabetical order instead of ascii(ABCabc) order? I am...
- As a healthcare provider in physical therapy, athletic training, or as an exercise scientist and personal...
- in the market for makeup artists, what happens after the invention of high-definition tv allowing viewers...
- 10. What are the three monetary policy tools of the Fed? Briefly describe how each tool...
- In what ways would the role of a manager working in a nonstandard international assignment arrangement...
- Write a Bash script called move that could replace the UNIX command mv. 'move' tries to...