Question
In: Statistics and Probability
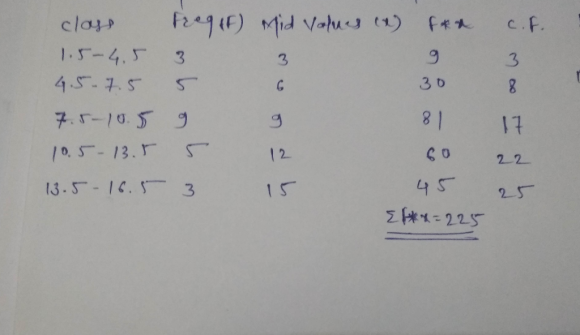
estimate the median and mode, is the this distribution symmetrical or skewed? Frequency Distribution: 1.5 to...
estimate the median and mode, is the this distribution symmetrical or skewed?
Frequency Distribution:
1.5 to 4.5 3
4.5 to 7.5 5
7.5 to 10.5 9
10.5 to 13.5 5
13.5 to 16.5 3
Solutions
Expert Solution
To find Median Class
= value of (n/2)th observation
= value of (25/2)th observation
= value of 12th observation
From the column of cumulative frequency cf, we find that the 12th
observation lies in the class
7.5-10.5.
∴ The median class is 7.5-10.5.
Now,
∴L=lower boundary point of median class =7.5
∴n=Total frequency =25
∴cf=Cumulative frequency of the class preceding the median class
=8
∴f=Frequency of the median class =9
∴c=class length of median class =3
Median M= L+((n/2-cf)/f) * c
=7.5+((12-8)/9)*3
=9.
To find Mode Class
Here, the maximum frequency is 9.
∴ The mode class is 7.5-10.5.
∴L=lower boundary point of mode class =7.5
∴f1= frequency of the mode class =9
∴f0= frequency of the preceding class =5
∴f2= frequency of the succeeding class =5
∴c= class length of mode class =3
Z=L+((f1-f0)/(2*f1-f0-f2))*c
=7.5+((9-5)/(2*9-5-5))*3
=9
Mean =∑f*x/∑f
=225/25
=9
Here, Median = Mode = Mean
Therefore, We conclude that distribution is symmetric.
Dear Student,
I am waiting for your feedback. I have given my 100% to solve your queries.If you are satisfied with my given answer. Can you please please like it.
Thank You!!!
 orchestra answered 3 years ago
Related Solutions
Find the mean, median, and mode for the scores in the following frequency distribution table: X...
If a distribution is skewed right, then the median for this population is smaller than the...
Q13 Briefly describe the following distribution shapes: [3 Marks] (a) Symmetrical distribution. (b) Positively skewed distribution....
Determine the mode of the frequency distribution given below?
Make an ungrouped frequency distribution for Price/Sales. Use the frequency distribution to find the mean, median,...
Calculate the MODE and MEDIAN. The measures of center for following GFDT. Data Frequency 60 -...
A bimodal distribution may never be what? 1. symmetrical 2. a frequency distribution 3. normal 4....
The median and mode of the following wage distribution of 320 workers are given as 48.15...
Losses have an Inverse Exponential distribution. The mode is 10,000. Calculate the median.
Mean , Median and Mode
- Problem 18-12 Various shareholders' equity topics; comprehensive [LO18-1, 18-4, 18-5, 18-6, 18-7, 18-8] Part A In...
- Hello There, This is discussion Question For Advanced Database Systems Question: (a) Please define what a...
- Physicians at a clinic gave what they thought were drugs to 860860 patients. Although the doctors...
- On January 1, 2018, bonds with a face value of $ 79,000 were sold. The bonds...
- How do I make this sort in true alphabetical order instead of ascii(ABCabc) order? I am...
- As a healthcare provider in physical therapy, athletic training, or as an exercise scientist and personal...
- in the market for makeup artists, what happens after the invention of high-definition tv allowing viewers...